Home / Research Tools
Research Tools
| | Corporate Profile: Prodigy Gold Inc
Publisher: Kaiser Research Online
Author: Copyright 2013 John A Kaiser
|
| |
Prodigy Gold Inc (PDG-V)
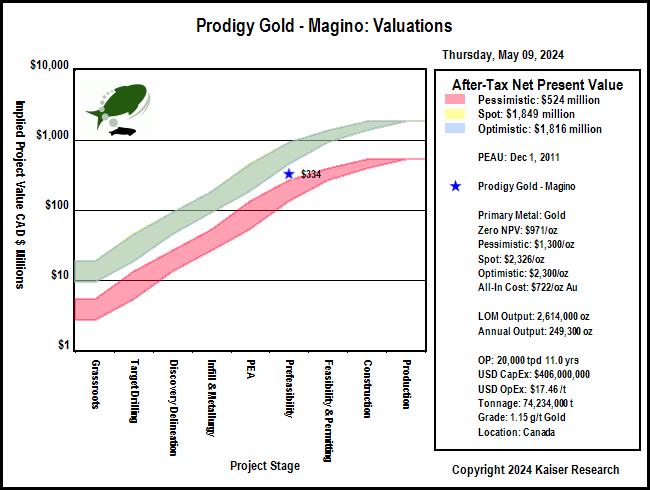
| Prodigy Gold changed its name from Kodiak Exploration in January 2011. The company is led by President and Chief Operating Officer Brian Maher, and CEO Terrence King, and is focused on gold exploration in Canada, primarily in Ontario. While previously focused on its Hercules gold project in the Beardmore-Geraldton gold camp where it reported numerous high-grade drill results in 2008 and 2009, since the company's August 2010 acquisition of Golden Goose Resouces, which controlled the Magino deposit with 450,000 measured and indicated gold ounces and 1.1 million inferred ounces, grading 6.4 grams per tonne, Magino has become the company's primary focus. A November 2011 43-101 for Magino increased the deposit size to 2.1 million indicated gold ounces and 1.7 million inferred, all grading 1.0 g/t Au. A December 2011 PEA forecast a pretax NPV of $939 million using a $1,200 gold price and a 5% disount rate. Prodigy has a feasibility study planned to be completed in Q4 2012 that will include an additional resource estimate update. In October 2012 the company announced it had agreed to be acquired by Argonaut Gold on the basis of 0.1042 Argonaut share and $0.001 per Prodigy share. |
Key to Understanding IPV Charts and Spec Value Hunter Tables
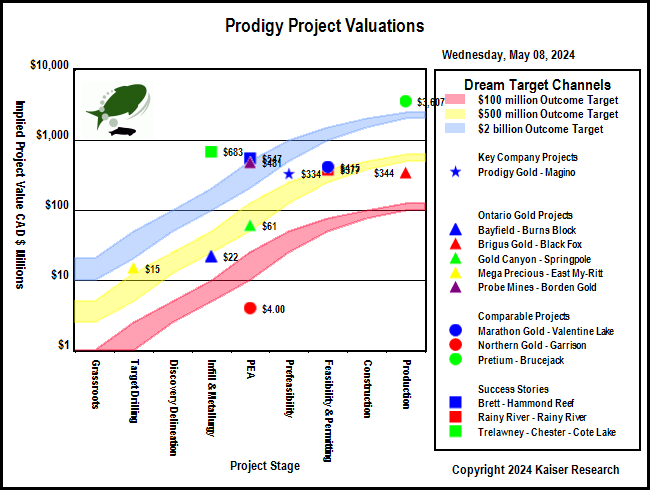
| An IPV Chart is a graphical presentation of a Spec Value Hunter table that has been constructed according to the Rational Speculation Model developed by John Kaiser. The IPV Chart allows speculators to identify which projects offer poor, fair or good speculative value in both absolute and relative terms. The speculative value depends on the project stage, the project's implied value as calculated by the company's fully diluted capitalization, stock price and net project interest, and the dream target deemed appropriate for the project. A dream target is what a project would be worth in discounted cash flow terms once in production. |
| Green background indicates the dream target judged appropriate for this play by John Kaiser - otherwise unranked. |
Poor Speculative Value -   |
Fair Speculative Value -  |
Good Speculative Value -   |
| Note: narrow arrows indicate IPV is outside the fair value channel but within 25% of the fair value limits |
| Click on the company name to view the company profile, the project name to view project details. |
| Click on the project icon if its background is shaded to get the IPV Chart for that company. |
| Magino |  | 90% WI | Canada | 6-Prefeasibility |
|---|
| Magino 43-101 Economic Study (USD except where noted otherwise) |
| PEAU | Dec 1, 2011 |
| Wardrop | Magino |
| Mining Scenario | TR | Mining Costs |
| Mining Type: | OP |
| Cost Currency: | USD |
| Processing Type: | CIP |
| Capital Cost: | $406,000,000 |
| Operating Rate: | 20,000 tpd |
| Sustaining Cost: | $145,000,000 |
| Operating Days: | 365 |
| Operating Cost: | $17.46/t |
| Strip Rate: | 2.1 |
| BC Cash Cost per Unit: USD | $511/oz Au |
| Mine Life: | 11 years |
| BC Cash Cost Net By-Products: USD | $511/oz Au |
| LOM Tonnage: | 74,234,000 t |
| BC All-In Cost Net By-Prod: USD | $722/oz Au |
| Est Startup: |
|
| Spot All-In Cost Net By-Prod: USD | $722/oz Au |
| Production Potential |
| Metal 1 | Metal 2 | Metal 3 | Metal 4 |
| Metal: | Au |
|
|
|
| Grade: | 1.15 g/t |
|
|
|
| Recovery: | 92.0% |
|
|
|
| Annual Output: | 249,300 oz |
|
|
|
| LOM Output: | 2,614,000 oz |
|
|
|
| Base Case Price: | $1,200/oz |
|
|
|
| Spot Price: | $1,315/oz |
|
|
|
| Base Case NSR: | $40.98/t |
|
|
|
| Spot NSR: | $44.91/t |
|
|
|
| Base Case Valuation |
| Reported Valuation Currency: | CDN |
| Pre-Tax NPV: | $939,000,000 |
| Discount Rate: | 5% |
| After-Tax NPV: |
|
| Total Base Case NSR USD: | $40.98/t |
| Pre-Tax IRR: | 36% |
| Total Spot NSR USD: | $44.91/t |
| After-Tax IRR: |
|
| Annual Pre-Tax Cash Flow Base Case and Net CF/FDSH USD: | $171,702,000 | $0.46 | Pre-Tax Payback: | 1.9 y |
| Annual Pre-Tax Cash Flow Spot and Net CF/FDSH USD: | $200,383,965 | $0.54 | After-Tax Payback: |
|
| Enterprise Value CAD : | $262,431,971 | $.84/sh | Share Price: | $0.96 |
| Note: |
| Comparative Valuations using Life of Mine Averages |
| Discount Rate: | 0% | 5% | 10% | 15% |
| Base Case Pre-Tax NPV USD: | $1,337,722,000 | $867,365,993 | $566,907,501 | $368,390,395 |
| Base Case Pre-Tax Net NPV/Sh USD: | $3.85 | $2.50 | $1.63 | $1.06 |
| Premium BC PT NPV over EV: | $3.20 | $1.84 | $0.98 | $0.41 |
| Spot Pre-Tax NPV USD: | $1,653,223,615 | $1,094,265,309 | $736,263,058 | $498,923,560 |
| Spot Pre-Tax Net NPV/Sh: | $4.76 | $3.15 | $2.12 | $1.44 |
| Premium Spot PT NPV over EV USD: | $4.10 | $2.50 | $1.47 | $0.78 |
| The comparative NPV calculations assume constant annual cash flow based on the life of mine average annual payable production and CapEx spent in year one. The operating cost includes the LOM sustaining capital. Due to details such as ore scheduling these NPV figures may differ from those of the 43-101 economic study. |
| After-Tax Valuations using Spot By-Product Prices |
 |
 |
|
| |
| | You can return to the Top of this page
|
|