Home / Research Tools
Research Tools
| | Corporate Profile: Brett Resources Inc
Publisher: Kaiser Research Online
Author: Copyright 2009 John A Kaiser
|
| |
Brett Resources Inc (BBR-V)
| Brett Resources Inc was part of the Ron Netolitzky stable headed by CEO Patrick Soares whose focus was the development of the Hammond Reef gold project in northwestern Ontario it optioned from Kinross in 2007 and acquired outright in June 2008 through a deal that made Kinross the largest shareholder and created a strategic alliance in the Yukon. Hammond Reef is a low grade deposit originally discovered in 1895 that had a historic resource of 2.5 million ounces when Brett optioned it in 2006. Brett consolidated the local land position and conducted infill drilling which led to an initial 43-101 resource estimate in October 2008 reporting an inferred resource of 141 million tonnes of 1.05 g/t gold representing 4.8 million ounces. An updated resource published in July 2009 boosted the resource to 6.7 million oz at 0.8 g/t gold using a 0.3 g/t cutoff grade. A preliminary economic assessment for an open pit mining scenario was published in November 2009 which demonstrated fairly robust economics at $825 gold. On March 22, 2010 Brett received a paper takeover bid from Osisko Mining Corp consisting of 0.34 Osisko for each Brett share which was valued at about $3 and represented a 52% premium over the market. Brett accepted the offer to which 77% of the shares were tendered; on August 11, 2010 shareholders approved a merger on the same terms for the remainder and on August 13, 2010 Brett was halted at $4.78 to allow completion of the merger. |
Key to Understanding IPV Charts and Spec Value Hunter Tables
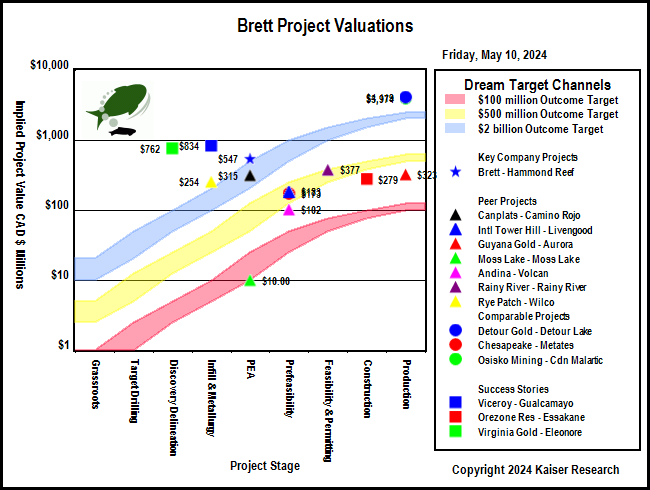
| An IPV Chart is a graphical presentation of a Spec Value Hunter table that has been constructed according to the Rational Speculation Model developed by John Kaiser. The IPV Chart allows speculators to identify which projects offer poor, fair or good speculative value in both absolute and relative terms. The speculative value depends on the project stage, the project's implied value as calculated by the company's fully diluted capitalization, stock price and net project interest, and the dream target deemed appropriate for the project. A dream target is what a project would be worth in discounted cash flow terms once in production. |
| Green background indicates the dream target judged appropriate for this play by John Kaiser - otherwise unranked. |
Poor Speculative Value -   |
Fair Speculative Value -  |
Good Speculative Value -   |
| Note: narrow arrows indicate IPV is outside the fair value channel but within 25% of the fair value limits |
| Click on the company name to view the company profile, the project name to view project details. |
| Click on the project icon if its background is shaded to get the IPV Chart for that company. |
| Hammond Reef |  | 100% WI | Canada | 5-PEA |
|---|
| Hammond Reef 43-101 Economic Study (USD except where noted otherwise) |
| PEA | Nov 27, 2009 |
| Scott Wilson RPA | Hammond Reef |
| Mining Scenario | TR | Mining Costs |
| Mining Type: | OP |
| Cost Currency: | USD |
| Processing Type: |
|
| Capital Cost: | $614,000,000 |
| Operating Rate: | 50,000 tpd |
| Sustaining Cost: | $158,000,000 |
| Operating Days: | 365 |
| Operating Cost: | $8.90/t |
| Strip Rate: | 1.4 |
| BC Cash Cost per Unit: USD | $440/oz Au |
| Mine Life: | 14 years |
| BC Cash Cost Net By-Products: USD | $440/oz Au |
| LOM Tonnage: | 245,000,000 t |
| BC All-In Cost Net By-Prod: USD | $590/oz Au |
| Est Startup: |
|
| Spot All-In Cost Net By-Prod: USD | $590/oz Au |
| Production Potential |
| Metal 1 | Metal 2 | Metal 3 | Metal 4 |
| Metal: | Au |
|
|
|
| Grade: | 0.70 g/t |
|
|
|
| Recovery: | 93.0% |
|
|
|
| Annual Output: | 369,000 oz |
|
|
|
| LOM Output: | 5,166,000 oz |
|
|
|
| Base Case Price: | $825/oz |
|
|
|
| Spot Price: | $1,315/oz |
|
|
|
| Base Case NSR: | $16.68/t |
|
|
|
| Spot NSR: | $26.59/t |
|
|
|
| Base Case Valuation |
| Reported Valuation Currency: | USD |
| Pre-Tax NPV: | $588,000,000 |
| Discount Rate: | 5% |
| After-Tax NPV: | $413,000,000 |
| Total Base Case NSR USD: | $16.68/t |
| Pre-Tax IRR: | 19% |
| Total Spot NSR USD: | $26.59/t |
| After-Tax IRR: | 15% |
| Annual Pre-Tax Cash Flow Base Case and Net CF/FDSH USD: | $142,000,000 | $1.14 | Pre-Tax Payback: | 4.2 y |
| Annual Pre-Tax Cash Flow Spot and Net CF/FDSH USD: | $322,828,450 | $2.72 | After-Tax Payback: | 4.6 y |
| Enterprise Value CAD : | $533,022,841 | $4.66/sh | Share Price: | $4.78 |
| Note: |
| Comparative Valuations using Life of Mine Averages |
| Discount Rate: | 0% | 5% | 10% | 15% |
| Base Case Pre-Tax NPV USD: | $1,216,000,000 | $647,517,886 | $317,210,263 | $116,757,166 |
| Base Case Pre-Tax Net NPV/Sh USD: | $10.62 | $5.66 | $2.77 | $1.02 |
| Premium BC PT NPV over EV: | $7.00 | $2.04 | ($0.85) | ($2.60) |
| Spot Pre-Tax NPV USD: | $3,747,598,300 | $2,352,237,789 | $1,528,216,330 | $1,016,885,907 |
| Spot Pre-Tax Net NPV/Sh: | $32.74 | $20.55 | $13.35 | $8.88 |
| Premium Spot PT NPV over EV USD: | $29.12 | $16.93 | $9.73 | $5.26 |
| The comparative NPV calculations assume constant annual cash flow based on the life of mine average annual payable production and CapEx spent in year one. The operating cost includes the LOM sustaining capital. Due to details such as ore scheduling these NPV figures may differ from those of the 43-101 economic study. |
| After-Tax Valuations using Spot By-Product Prices |
 |
 |
|
| |
| | You can return to the Top of this page
|
|