Home / Research Tools
Research Tools
| | Corporate Profile: Magellan Minerals Ltd
Publisher: Kaiser Research Online
Author: Copyright 2009 John A. Kaiser
|
| |
Magellan Minerals Ltd (MNM-V)
| Magellan Minerals Ltd. is an exploration company focused on the state of Para in northern Brazil. Led by Alan Carter and Dennis Moore, Magellan owns properties in the Tapajos region, which has historic alluvial gold production estimated at 20-30 Moz of gold. The flagship project is Cuiú Cuiú where Magellan has assembled access rights from the garimpeiros that has allowed it to test bedrock targets underlying a large gold in soil anomaly. In September 2009 Magellen acquired fellow Brazil-focused explorer Chapleau Resources on the basis of 0.267 Magellen shares per Chapleau share. Shortly after the closing of the transaction Magellan announced its first resource estimate, 269,000 indicated gold ounces with 98,000 ounces in the inferred category, at the Coringa property which had been Chapleau's flagship. |
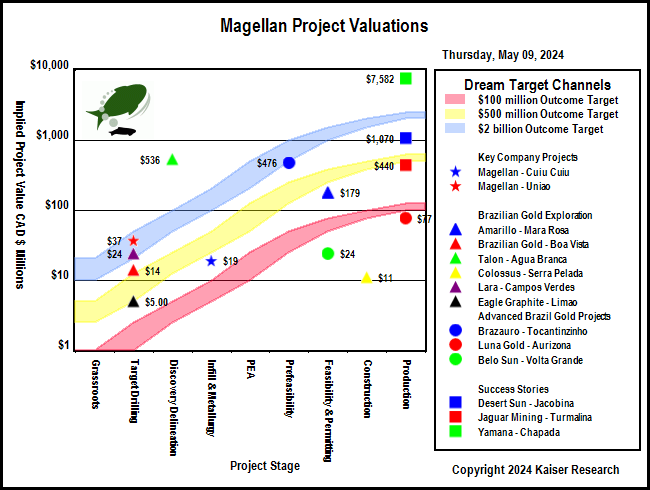
Key to Understanding IPV Charts and Spec Value Hunter Tables
| An IPV Chart is a graphical presentation of a Spec Value Hunter table that has been constructed according to the Rational Speculation Model developed by John Kaiser. The IPV Chart allows speculators to identify which projects offer poor, fair or good speculative value in both absolute and relative terms. The speculative value depends on the project stage, the project's implied value as calculated by the company's fully diluted capitalization, stock price and net project interest, and the dream target deemed appropriate for the project. A dream target is what a project would be worth in discounted cash flow terms once in production. |
| Green background indicates the dream target judged appropriate for this play by John Kaiser - otherwise unranked. |
Poor Speculative Value -   |
Fair Speculative Value -  |
Good Speculative Value -   |
| Note: narrow arrows indicate IPV is outside the fair value channel but within 25% of the fair value limits |
| Click on the company name to view the company profile, the project name to view project details. |
| Click on the project icon if its background is shaded to get the IPV Chart for that company. |
| Coringa |  | 100% WI | Brazil | 5-PEA |
|---|
| Coringa 43-101 Economic Study (USD except where noted otherwise) |
| PEA | Dec 6, 2012 |
| Global Resource Enginnering | Coringa |
| Mining Scenario | TR | Mining Costs |
| Mining Type: | UG |
| Cost Currency: | USD |
| Processing Type: |
|
| Capital Cost: | $64,500,000 |
| Operating Rate: | 750 tpd |
| Sustaining Cost: | $51,500,000 |
| Operating Days: | 365 |
| Operating Cost: | $106.00/t |
| Strip Rate: |
|
| BC Cash Cost per Unit: USD | $617/oz Au |
| Mine Life: | 9 years |
| BC Cash Cost Net By-Products: USD | $617/oz Au |
| LOM Tonnage: | 1,996,496 t |
| BC All-In Cost Net By-Prod: USD | $907/oz Au |
| Est Startup: |
|
| Spot All-In Cost Net By-Prod: USD | $907/oz Au |
| Production Potential |
| Metal 1 | Metal 2 | Metal 3 | Metal 4 |
| Metal: | Au |
|
|
|
| Grade: | 6.66 g/t |
|
|
|
| Recovery: | 93.5% |
|
|
|
| Annual Output: | 47,047 oz |
|
|
|
| LOM Output: | 399,906 oz |
|
|
|
| Base Case Price: | $1,350/oz |
|
|
|
| Spot Price: | $1,315/oz |
|
|
|
| Base Case NSR: | $232.01/t |
|
|
|
| Spot NSR: | $226.01/t |
|
|
|
| Base Case Valuation |
| Reported Valuation Currency: | USD |
| Pre-Tax NPV: |
|
| Discount Rate: | 5% |
| After-Tax NPV: | $109,900,000 |
| Total Base Case NSR USD: | $232.01/t |
| Pre-Tax IRR: |
|
| Total Spot NSR USD: | $226.01/t |
| After-Tax IRR: | 33% |
| Annual Pre-Tax Cash Flow Base Case and Net CF/FDSH USD: | $34,495,950 | $0.11 | Pre-Tax Payback: | 2.9 y |
| Annual Pre-Tax Cash Flow Spot and Net CF/FDSH USD: | $32,851,657 | $0.10 | After-Tax Payback: |
|
| Enterprise Value CAD : | $24,517,929 | $.10/sh | Share Price: | $0.08 |
| Note: |
| Comparative Valuations using Life of Mine Averages |
| Discount Rate: | 0% | 5% | 10% | 15% |
| Base Case Pre-Tax NPV USD: | $159,967,600 | $111,283,554 | $77,445,236 | $53,397,640 |
| Base Case Pre-Tax Net NPV/Sh USD: | $0.63 | $0.44 | $0.30 | $0.21 |
| Premium BC PT NPV over EV: | $0.55 | $0.36 | $0.23 | $0.13 |
| Spot Pre-Tax NPV USD: | $146,813,259 | $101,162,208 | $69,470,527 | $46,981,579 |
| Spot Pre-Tax Net NPV/Sh: | $0.58 | $0.40 | $0.27 | $0.18 |
| Premium Spot PT NPV over EV USD: | $0.50 | $0.32 | $0.20 | $0.11 |
| The comparative NPV calculations assume constant annual cash flow based on the life of mine average annual payable production and CapEx spent in year one. The operating cost includes the LOM sustaining capital. Due to details such as ore scheduling these NPV figures may differ from those of the 43-101 economic study. |
| After-Tax Valuations using Spot By-Product Prices |
 |
 |
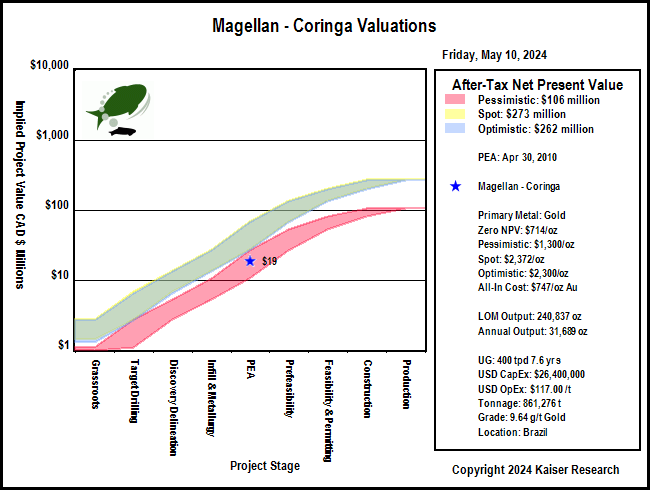
| Coringa 43-101 Economic Study (USD except where noted otherwise) |
| PEA | Apr 30, 2010 |
| Global Resource Enginnering | Coringa |
| Mining Scenario | TR | Mining Costs |
| Mining Type: | UG |
| Cost Currency: | USD |
| Processing Type: | CIL |
| Capital Cost: | $26,400,000 |
| Operating Rate: | 400 tpd |
| Sustaining Cost: | $23,600,000 |
| Operating Days: | 365 |
| Operating Cost: | $117.00/t |
| Strip Rate: |
|
| BC Cash Cost per Unit: USD | $539/oz Au |
| Mine Life: | 8 years |
| BC Cash Cost Net By-Products: USD | $539/oz Au |
| LOM Tonnage: | 861,276 t |
| BC All-In Cost Net By-Prod: USD | $747/oz Au |
| Est Startup: |
|
| Spot All-In Cost Net By-Prod: USD | $747/oz Au |
| Production Potential |
| Metal 1 | Metal 2 | Metal 3 | Metal 4 |
| Metal: | Au |
|
|
|
| Grade: | 9.64 g/t |
|
|
|
| Recovery: | 93.5% |
|
|
|
| Annual Output: | 31,689 oz |
|
|
|
| LOM Output: | 240,837 oz |
|
|
|
| Base Case Price: | $950/oz |
|
|
|
| Spot Price: | $1,315/oz |
|
|
|
| Base Case NSR: | $206.20/t |
|
|
|
| Spot NSR: | $285.43/t |
|
|
|
| Base Case Valuation |
| Reported Valuation Currency: | USD |
| Pre-Tax NPV: | $41,265,000 |
| Discount Rate: | 5% |
| After-Tax NPV: |
|
| Total Base Case NSR USD: | $206.20/t |
| Pre-Tax IRR: | 34% |
| Total Spot NSR USD: | $285.43/t |
| After-Tax IRR: |
|
| Annual Pre-Tax Cash Flow Base Case and Net CF/FDSH USD: | $13,022,550 | $0.04 | Pre-Tax Payback: | 3.7 y |
| Annual Pre-Tax Cash Flow Spot and Net CF/FDSH USD: | $24,590,619 | $0.09 | After-Tax Payback: |
|
| Enterprise Value CAD : | $24,517,929 | $.10/sh | Share Price: | $0.08 |
| Note: |
| Comparative Valuations using Life of Mine Averages |
| Discount Rate: | 0% | 5% | 10% | 15% |
| Base Case Pre-Tax NPV USD: | $54,180,400 | $36,858,127 | $24,851,192 | $16,346,757 |
| Base Case Pre-Tax Net NPV/Sh USD: | $0.21 | $0.14 | $0.10 | $0.06 |
| Premium BC PT NPV over EV: | $0.14 | $0.07 | $0.02 | ($0.01) |
| Spot Pre-Tax NPV USD: | $146,724,956 | $108,064,693 | $80,955,552 | $61,485,580 |
| Spot Pre-Tax Net NPV/Sh: | $0.58 | $0.42 | $0.32 | $0.24 |
| Premium Spot PT NPV over EV USD: | $0.50 | $0.35 | $0.24 | $0.17 |
| The comparative NPV calculations assume constant annual cash flow based on the life of mine average annual payable production and CapEx spent in year one. The operating cost includes the LOM sustaining capital. Due to details such as ore scheduling these NPV figures may differ from those of the 43-101 economic study. |
| After-Tax Valuations using Spot By-Product Prices |
 |
 |
|
| |
| | You can return to the Top of this page
|
|