Home / Research Tools
Research Tools
| | Corporate Profile: Clifton Star Resources Inc
Publisher: Kaiser Research Online
Author: Copyright 2013 John A Kaiser
|
| |
Clifton Star Resources Inc (CFO-V)
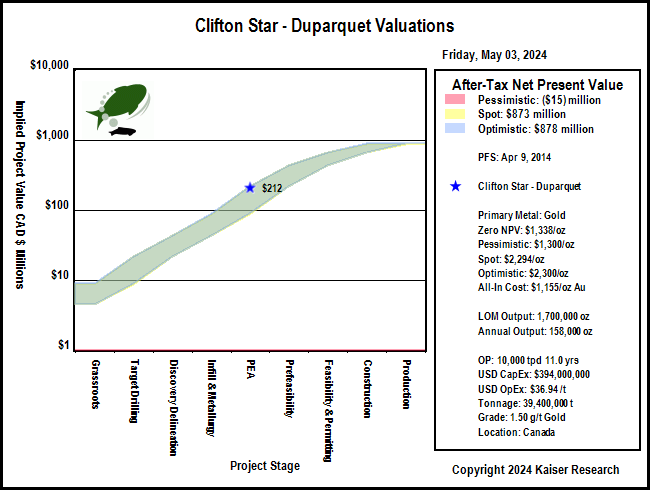
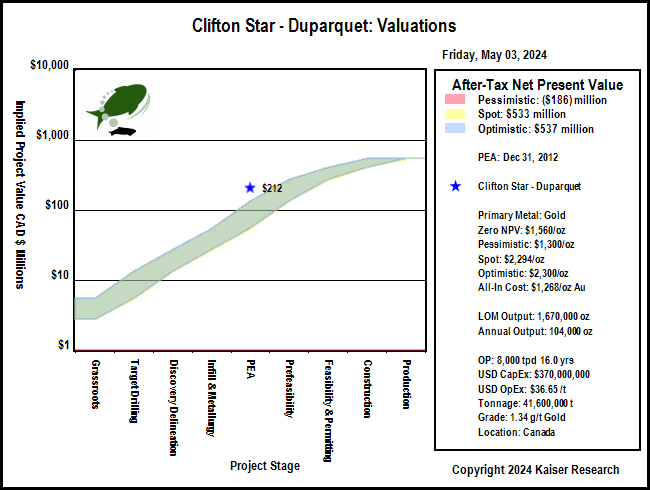
| Clifton Star Resources Inc, headed by CEO Michel Bouchard, has an option to acquire 100% of the Duparquet project for $50.2 million in annual staged payments by Dec 1, 2017. Duparquet is a former underground gold mine (2.9 million oz 1933-1956) near the Destor-Porcupine Fault on the Quebec side of the Abitibi Greenstone Belt which Clifton Star plans to redevelop as an open-pit mine. A PEA published in January 2013 proposed an 8,000 tpd open-pit operation with a milling, flotation, pressure oxidation and CIL circuit to handle the refractory sulphide ore to produce 1.67 million oz over a 16 year mine life. A PFS which boosts output to 10,000 tpd over an 11 year mine life and is robust at $1,300 gold is expected in Q2 of 2014, following which a $3-$5 million feasibility study expected to take another year will be required, provided the $10 million payment due Dec 1, 2014 is made. |
Key to Understanding IPV Charts and Spec Value Hunter Tables
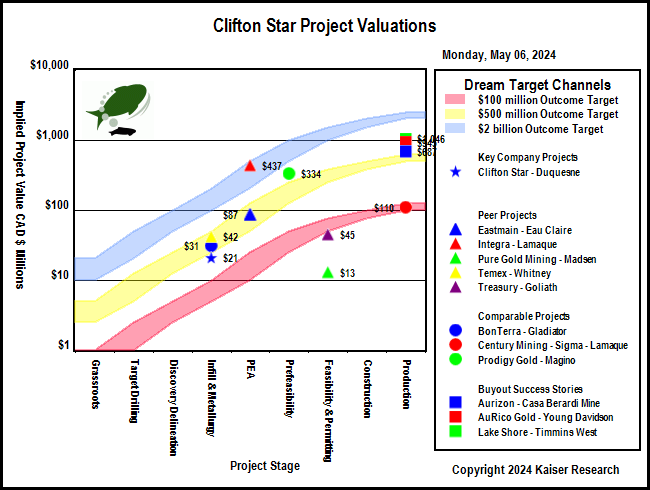
| An IPV Chart is a graphical presentation of a Spec Value Hunter table that has been constructed according to the Rational Speculation Model developed by John Kaiser. The IPV Chart allows speculators to identify which projects offer poor, fair or good speculative value in both absolute and relative terms. The speculative value depends on the project stage, the project's implied value as calculated by the company's fully diluted capitalization, stock price and net project interest, and the dream target deemed appropriate for the project. A dream target is what a project would be worth in discounted cash flow terms once in production. |
| Green background indicates the dream target judged appropriate for this play by John Kaiser - otherwise unranked. |
Poor Speculative Value -   |
Fair Speculative Value -  |
Good Speculative Value -   |
| Note: narrow arrows indicate IPV is outside the fair value channel but within 25% of the fair value limits |
| Click on the company name to view the company profile, the project name to view project details. |
| Click on the project icon if its background is shaded to get the IPV Chart for that company. |
| Duparquet |  | 10% WI | Canada | 5-PEA |
|---|
| Duparquet 43-101 Economic Study (USD except where noted otherwise) |
| PFS | May 23, 2014 |
| InnovExplo | Duparquet |
| Mining Scenario | TR | Mining Costs |
| Mining Type: | OP |
| Cost Currency: | USD |
| Processing Type: | POX |
| Capital Cost: | $394,000,000 |
| Operating Rate: | 10,000 tpd |
| Sustaining Cost: | $118,000,000 |
| Operating Days: | 365 |
| Operating Cost: | $36.94/t |
| Strip Rate: | 8.3 |
| BC Cash Cost per Unit: USD | $853/oz Au |
| Mine Life: | 11 years |
| BC Cash Cost Net By-Products: USD | $853/oz Au |
| LOM Tonnage: | 39,400,000 t |
| BC All-In Cost Net By-Prod: USD | $1,155/oz Au |
| Est Startup: |
|
| Spot All-In Cost Net By-Prod: USD | $1,155/oz Au |
| Production Potential |
| Metal 1 | Metal 2 | Metal 3 | Metal 4 |
| Metal: | Au |
|
|
|
| Grade: | 1.50 g/t |
|
|
|
| Recovery: | 90.1% |
|
|
|
| Annual Output: | 158,000 oz |
|
|
|
| LOM Output: | 1,700,000 oz |
|
|
|
| Base Case Price: | $1,300/oz |
|
|
|
| Spot Price: | $1,315/oz |
|
|
|
| Base Case NSR: | $56.27/t |
|
|
|
| Spot NSR: | $56.93/t |
|
|
|
| Base Case Valuation |
| Reported Valuation Currency: | USD |
| Pre-Tax NPV: | $222,000,000 |
| Discount Rate: | 5% |
| After-Tax NPV: | $135,000,000 |
| Total Base Case NSR USD: | $56.27/t |
| Pre-Tax IRR: | 15% |
| Total Spot NSR USD: | $56.93/t |
| After-Tax IRR: | 12% |
| Annual Pre-Tax Cash Flow Base Case and Net CF/FDSH USD: | $70,569,000 | $0.11 | Pre-Tax Payback: | 4.3 y |
| Annual Pre-Tax Cash Flow Spot and Net CF/FDSH USD: | $72,946,900 | $0.12 | After-Tax Payback: |
|
| Enterprise Value CAD : | $8,900,023 | $.17/sh | Share Price: | $0.41 |
| Note: |
| Comparative Valuations using Life of Mine Averages |
| Discount Rate: | 0% | 5% | 10% | 15% |
| Base Case Pre-Tax NPV USD: | $264,259,000 | $98,162,071 | ($4,840,301) | ($70,265,776) |
| Base Case Pre-Tax Net NPV/Sh USD: | $0.50 | $0.19 | ($0.01) | ($0.13) |
| Premium BC PT NPV over EV: | $0.37 | $0.06 | ($0.14) | ($0.27) |
| Spot Pre-Tax NPV USD: | $290,415,900 | $116,973,330 | $9,200,250 | ($59,443,826) |
| Spot Pre-Tax Net NPV/Sh: | $0.55 | $0.22 | $0.02 | ($0.11) |
| Premium Spot PT NPV over EV USD: | $0.42 | $0.09 | ($0.11) | ($0.25) |
| The comparative NPV calculations assume constant annual cash flow based on the life of mine average annual payable production and CapEx spent in year one. The operating cost includes the LOM sustaining capital. Due to details such as ore scheduling these NPV figures may differ from those of the 43-101 economic study. |
| After-Tax Valuations using Spot By-Product Prices |
 |
 |
| Duparquet 43-101 Economic Study (USD except where noted otherwise) |
| PEA | Dec 31, 2012 |
| InnovExplo | Duparquet |
| Mining Scenario | TR | Mining Costs |
| Mining Type: | OP |
| Cost Currency: | USD |
| Processing Type: |
|
| Capital Cost: | $370,000,000 |
| Operating Rate: | 8,000 tpd |
| Sustaining Cost: | $166,000,000 |
| Operating Days: | 336 |
| Operating Cost: | $36.65/t |
| Strip Rate: | 5.5 |
| BC Cash Cost per Unit: USD | $947/oz Au |
| Mine Life: | 16 years |
| BC Cash Cost Net By-Products: USD | $947/oz Au |
| LOM Tonnage: | 41,600,000 t |
| BC All-In Cost Net By-Prod: USD | $1,268/oz Au |
| Est Startup: |
|
| Spot All-In Cost Net By-Prod: USD | $1,268/oz Au |
| Production Potential |
| Metal 1 | Metal 2 | Metal 3 | Metal 4 |
| Metal: | Au |
|
|
|
| Grade: | 1.34 g/t |
|
|
|
| Recovery: | 93.2% |
|
|
|
| Annual Output: | 104,000 oz |
|
|
|
| LOM Output: | 1,670,000 oz |
|
|
|
| Base Case Price: | $1,472/oz |
|
|
|
| Spot Price: | $1,315/oz |
|
|
|
| Base Case NSR: | $56.95/t |
|
|
|
| Spot NSR: | $50.88/t |
|
|
|
| Base Case Valuation |
| Reported Valuation Currency: | USD |
| Pre-Tax NPV: | $382,000,000 |
| Discount Rate: | 5% |
| After-Tax NPV: | $234,670,252 |
| Total Base Case NSR USD: | $56.95/t |
| Pre-Tax IRR: | 20% |
| Total Spot NSR USD: | $50.88/t |
| After-Tax IRR: | 15% |
| Annual Pre-Tax Cash Flow Base Case and Net CF/FDSH USD: | $54,572,800 | $0.08 | Pre-Tax Payback: | 4.2 y |
| Annual Pre-Tax Cash Flow Spot and Net CF/FDSH USD: | $38,250,000 | $0.05 | After-Tax Payback: |
|
| Enterprise Value CAD : | $8,900,023 | $.17/sh | Share Price: | $0.41 |
| Note: |
| Comparative Valuations using Life of Mine Averages |
| Discount Rate: | 0% | 5% | 10% | 15% |
| Base Case Pre-Tax NPV USD: | $337,164,800 | $103,814,830 | ($22,008,446) | ($92,900,798) |
| Base Case Pre-Tax Net NPV/Sh USD: | $0.64 | $0.20 | ($0.04) | ($0.18) |
| Premium BC PT NPV over EV: | $0.51 | $0.07 | ($0.17) | ($0.31) |
| Spot Pre-Tax NPV USD: | $76,000,000 | ($64,663,975) | ($138,103,747) | ($177,413,655) |
| Spot Pre-Tax Net NPV/Sh: | $0.15 | ($0.12) | ($0.26) | ($0.34) |
| Premium Spot PT NPV over EV USD: | $0.01 | ($0.26) | ($0.40) | ($0.47) |
| The comparative NPV calculations assume constant annual cash flow based on the life of mine average annual payable production and CapEx spent in year one. The operating cost includes the LOM sustaining capital. Due to details such as ore scheduling these NPV figures may differ from those of the 43-101 economic study. |
| After-Tax Valuations using Spot By-Product Prices |
 |
 |
|
| |
| | You can return to the Top of this page
|
|