| |
Queenston Mining Inc (QMI-T)
| Queenston Mining, led by CEO Charles Page and Chairman Hugh Harbinson, is a Canadian-focused gold explorer-developer with a portfolio of 100% owned and joint-ventured properties in Ontario's Kirkland Lake and Quebec's Cadillac Break gold camps. At Kirkland Lake where Queenston's property package exceeds 14,000 hectares and hosts eight gold deposits, the company's focus is on the 100% owned Kirkland Lake, Upper Beaver, and McBearn properties, and the South Claims joint venture with Kirkland Lake Gold. Queenston's strategy at Kirkland Lake is to develop 2 million ounces of gold resources that can be processed through a central facilty. In February, 2012, Queenston completed a PEA on the Upper Beaver project outlining an initial 10-year mine life operating at 2,000 tonnes per day. Over the life of mine, Upper Beaver is expected to produce a total of 1.1 million ounces of gold at an average rate of 120,000 ounces per year and average cash costs of $386 (U.S.) per ounce (net of byproduct credits). Using a gold price of $1,275 (U.S.) per ounce, the PEA shows that Upper Beaver has an after-tax internal rate of return of 22.1 per cent. In March 2010 Queenston announced it would be acquiring Kirkland Lake-focused explorer Vault Minerals on the basis of 1 Queenston share per 10 Vault shares. In November 2012 Queenston announced it had agreed to be acquired by Osisko for 0.61 Osisko shares, or $6 per share at the time of annoucement, a $550 million transaction. |
Key to Understanding IPV Charts and Spec Value Hunter Tables
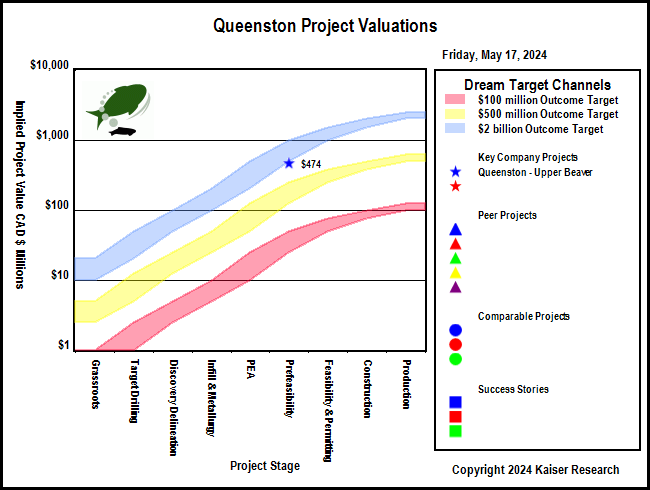
| An IPV Chart is a graphical presentation of a Spec Value Hunter table that has been constructed according to the Rational Speculation Model developed by John Kaiser. The IPV Chart allows speculators to identify which projects offer poor, fair or good speculative value in both absolute and relative terms. The speculative value depends on the project stage, the project's implied value as calculated by the company's fully diluted capitalization, stock price and net project interest, and the dream target deemed appropriate for the project. A dream target is what a project would be worth in discounted cash flow terms once in production. |
| Green background indicates the dream target judged appropriate for this play by John Kaiser - otherwise unranked. |
Poor Speculative Value -   |
Fair Speculative Value -  |
Good Speculative Value -   |
| Note: narrow arrows indicate IPV is outside the fair value channel but within 25% of the fair value limits |
| Click on the company name to view the company profile, the project name to view project details. |
| Click on the project icon if its background is shaded to get the IPV Chart for that company. |
Queenston Project Valuations
| Company | Project | Country | Stage | IPV $
MM |
$100 | UPV
$500 |
$2000 | Target Metals | Deposit Style |
| Key Company Projects |
 |
Queenston Mining Inc (QMI-T) | Upper Beaver |  | Canada | Prefeasibility |
$474 | | |
| Gold Copper | Quartz Veins |
|
|
| Peer Projects |
|
|
|
|
|
|
| Comparable Projects |
|
|
|
|
| Success Stories |
|
|
|
| Upper Beaver |  | 100% WI | Canada | 6-Prefeasibility |
|---|
| Upper Beaver 43-101 Economic Study (USD except where noted otherwise) |
| PFS | Feb 16, 2012 |
| P & E Mining Consultants | Upper Beaver |
| Mining Scenario | TR | Mining Costs |
| Mining Type: | UG |
| Cost Currency: | USD |
| Processing Type: |
|
| Capital Cost: | $240,000,000 |
| Operating Rate: | 2,000 tpd |
| Sustaining Cost: | $178,000,000 |
| Operating Days: | 365 |
| Operating Cost: | $73.06/t |
| Strip Rate: |
|
| BC Cash Cost per Unit: USD | $444/oz Au |
| Mine Life: | 10 years |
| BC Cash Cost Net By-Products: USD | $312/oz Au |
| LOM Tonnage: | 6,894,000 t |
| BC All-In Cost Net By-Prod: USD | $708/oz Au |
| Est Startup: |
|
| Spot All-In Cost Net By-Prod: USD | $704/oz Au |
| Production Potential |
| Metal 1 | Metal 2 | Metal 3 | Metal 4 |
| Metal: | Au | Cu |
|
|
| Grade: | 5.10 g/t | 0.37% |
|
|
| Recovery: | 98.0% | 90.0% |
|
|
| Annual Output: | 120,000 oz | 5,300,000 lb |
|
|
| LOM Output: | 1,055,200 oz | 50,500,000 lb |
|
|
| Base Case Price: | $1,275/oz | $3.00/lb |
|
|
| Spot Price: | $1,315/oz | $3.10/lb |
|
|
| Base Case NSR: | $209.59/t | $21.78/t |
|
|
| Spot NSR: | $216.17/t | $22.51/t |
|
|
| Base Case Valuation |
| Reported Valuation Currency: | USD |
| Pre-Tax NPV: |
|
| Discount Rate: | 5% |
| After-Tax NPV: | $233,400,000 |
| Total Base Case NSR USD: | $231.37/t |
| Pre-Tax IRR: |
|
| Total Spot NSR USD: | $238.68/t |
| After-Tax IRR: | 22% |
| Annual Pre-Tax Cash Flow Base Case and Net CF/FDSH USD: | $115,566,200 | $1.04 | Pre-Tax Payback: |
|
| Annual Pre-Tax Cash Flow Spot and Net CF/FDSH USD: | $120,902,200 | $1.10 | After-Tax Payback: | 2.3 y |
| Enterprise Value CAD : | $429,281,504 | $4.56/sh | Share Price: | $5.04 |
| Note: |
| Comparative Valuations using Life of Mine Averages |
| Discount Rate: | 0% | 5% | 10% | 15% |
| Base Case Pre-Tax NPV USD: | $737,662,000 | $490,404,459 | $327,937,251 | $217,970,380 |
| Base Case Pre-Tax Net NPV/Sh USD: | $7.84 | $5.21 | $3.48 | $2.32 |
| Premium BC PT NPV over EV: | $4.29 | $1.66 | ($0.06) | ($1.23) |
| Spot Pre-Tax NPV USD: | $791,022,000 | $529,645,580 | $357,743,988 | $241,257,467 |
| Spot Pre-Tax Net NPV/Sh: | $8.41 | $5.63 | $3.80 | $2.56 |
| Premium Spot PT NPV over EV USD: | $4.86 | $2.08 | $0.25 | ($0.98) |
| The comparative NPV calculations assume constant annual cash flow based on the life of mine average annual payable production and CapEx spent in year one. The operating cost includes the LOM sustaining capital. Due to details such as ore scheduling these NPV figures may differ from those of the 43-101 economic study. |
| After-Tax Valuations using Spot By-Product Prices |
 |
 |
|