|
Supply and Demand Potential in the Rare Earth Sector
The charts below are a work in progress as we try to understand competing demand projections as well as the structure of rare earth supply over the next decade. These charts will be updated periodically to reflect current REO prices and changes in our assumptions about production timelines, recoveries, and projects in our supply queue.
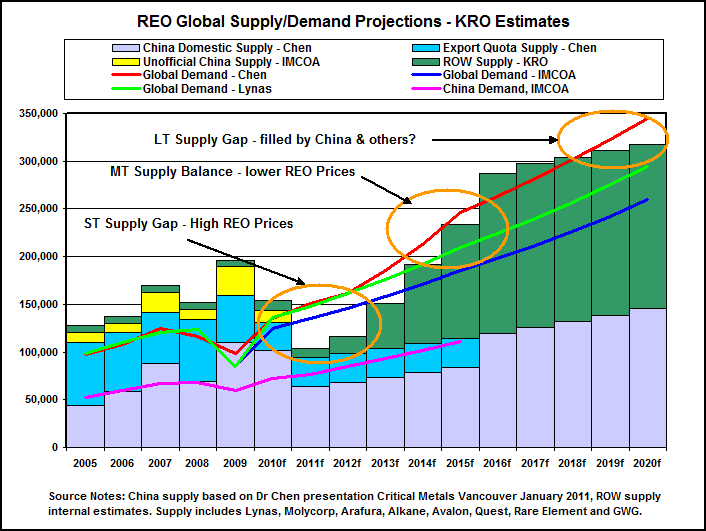
In the first batch we have attempted to assemble a supply-demand picture. The first three charts represent the 5 year outlook by the foremost authorities whose projections are in the public domain: IMCOA (Dudley Kingsnorth), which tends to be conservative about demand and optimistic about Chinese supply, Lynas, which is more optimistic about demand and but pessimistic about Chinese supply growth, and Dr Chen (Chinese Society of Rare Earths) who has a bird's eye view of China's policy goals and the underlying reality.
In the fourth and fifth charts we combine these demand projections with our own supply projections which combines Dr Chen's prediction of Chinese supply through 2015 with our own supply projection which accepts proclamations by Toyota regarding its plans in India and Vietnam, but only includes public companies which have published JORC or 43-101 compliant resource estimates, metallurgy study based recovery estimates, and preliminary economic assessment (PEA) equivalent or better information about mining plans and associated costs. We have included Great Western's Steenkampskraal because whether or not it goes into production is inconsequential, and to leave out this widely promoted bubble stock would raise too many questions. We have excluded GMEL's Kvanefjeld project because Greenland has not lifted its ban on uranium mining and because the proposed production scale is not synchronized with actual development work on the project.
Take note that in chart 5 which projects supply-demand through 2020 we have not added production from other mines, including China, for 2017-2020. As companies meet our minimum disclosure threshold we will add them to our supply projections. Also, take note that our three authorities have not published demand projections beyond 2015; we have taken the liberty of extending their demand projections by applying the average compounded growth rate they used for 2010-2015.
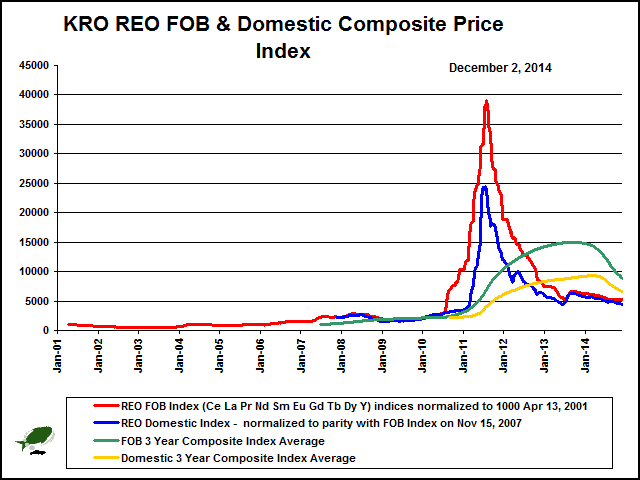
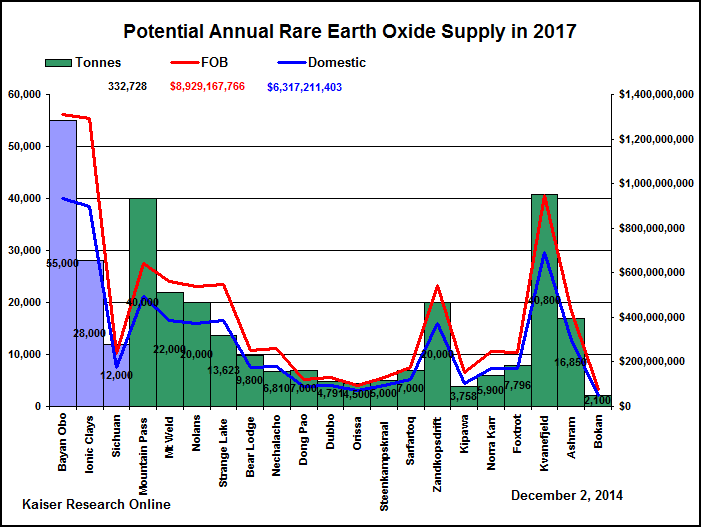
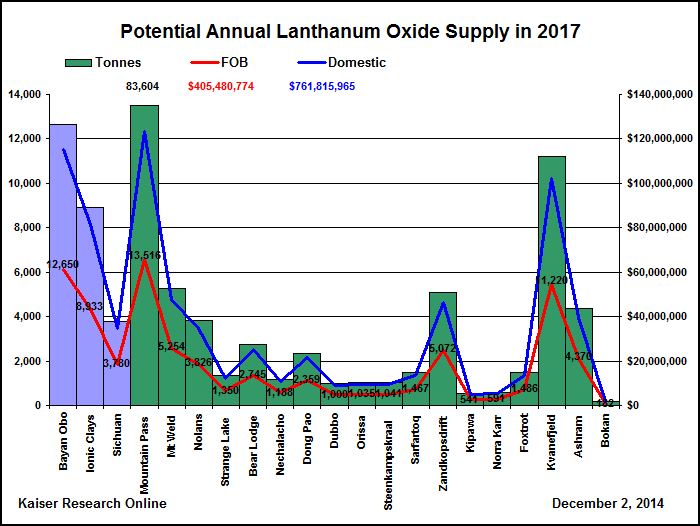
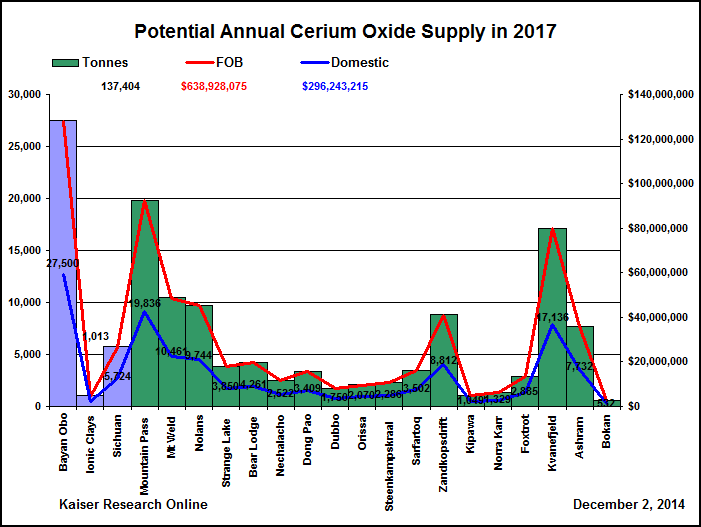
The next batch of charts is headed by a table presenting the spot and three year average rare earth oxide FOB and domestic prices we used to estimate the value of projected supply. The next two charts present projected supply in 2016 broken down according to individual rare earth oxides and according to individual operations. The individual operations have been ordered according to total rare earth supply in 2016, starting with China, and followed by the rest of the world's operations. We show what the supply is worth in both FOB and domestic spot price terms.
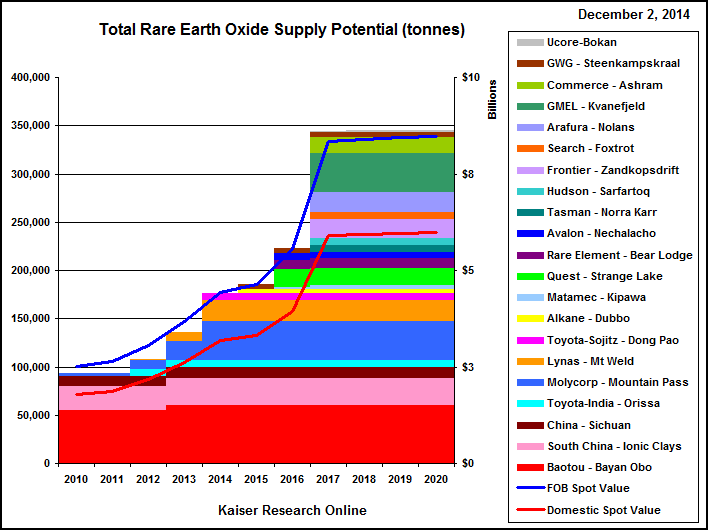
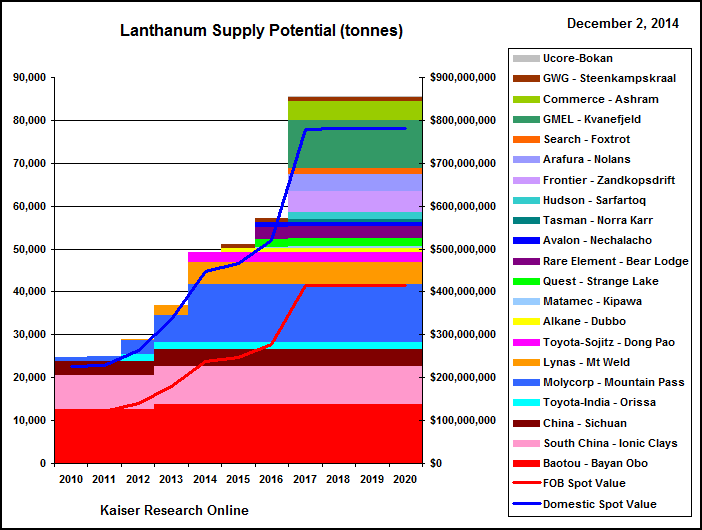
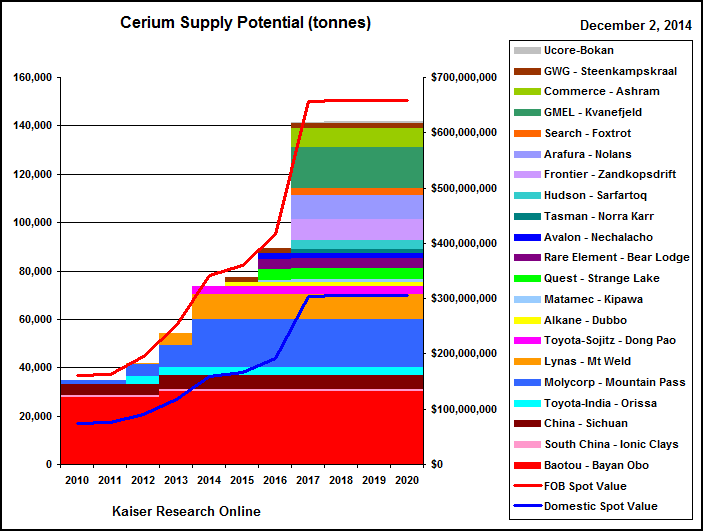
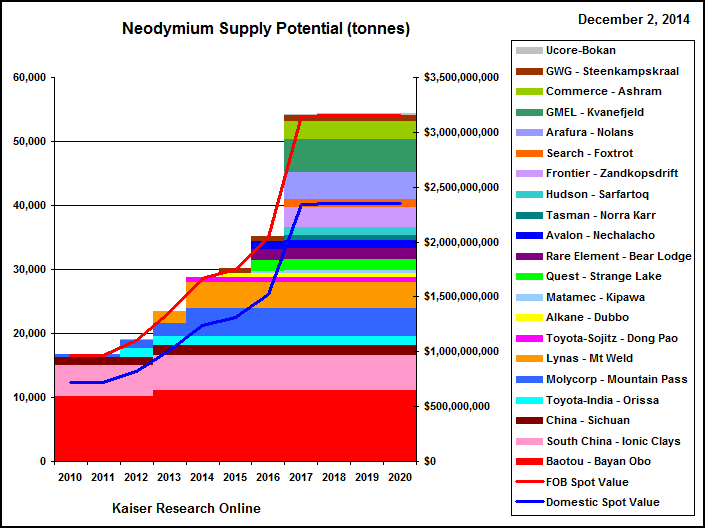
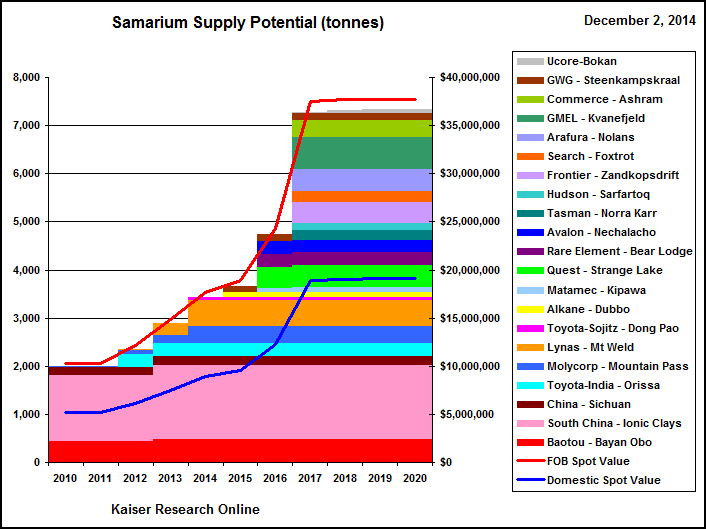
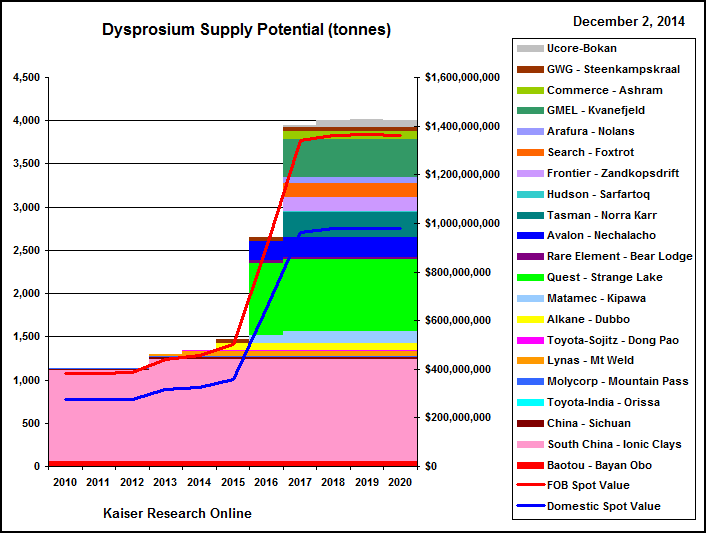
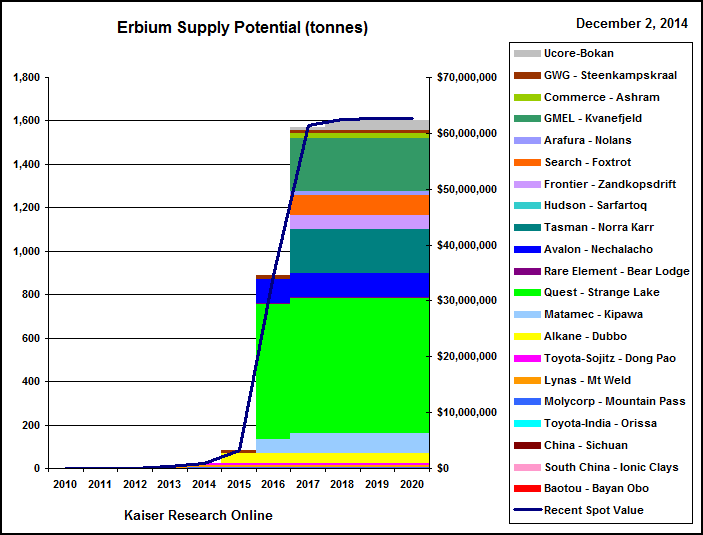
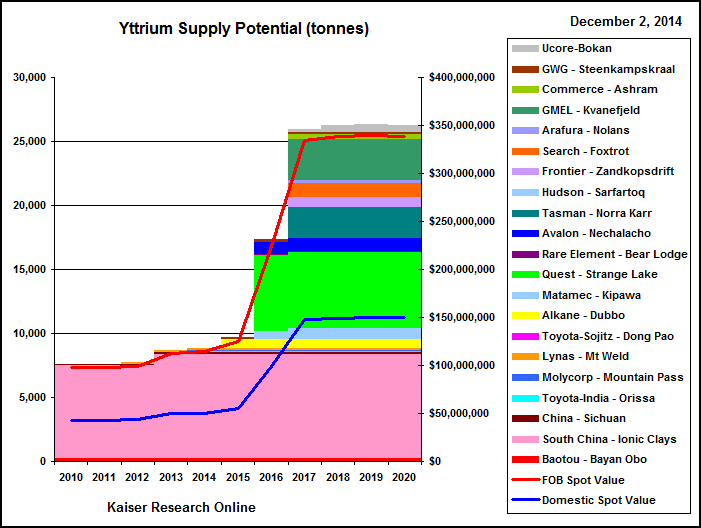
The next chart displays supply evolution from 2010-2020 with the stacking order based on total annual supply when in full production, Chinese operations first, rest of world second. We have included a graph of the Lynas demand forecast for 2010-2015 to give some perspective for the relationship between projected supply and demand. We do not have an opinion on future rare earth demand because we believe that a wild dynamic is at play that involves innovation, policy and strategic second-guessing which makes future demand chaotic. The supply-demand balance is further complicated by uncertainty about the ability of mines to perform according to technical and timeline expectations. We subscribe to the view that because rare earth demand is not strictly tied to the business cycle, demand will be responsive to "field of dreams" style "if you build it, they will come".
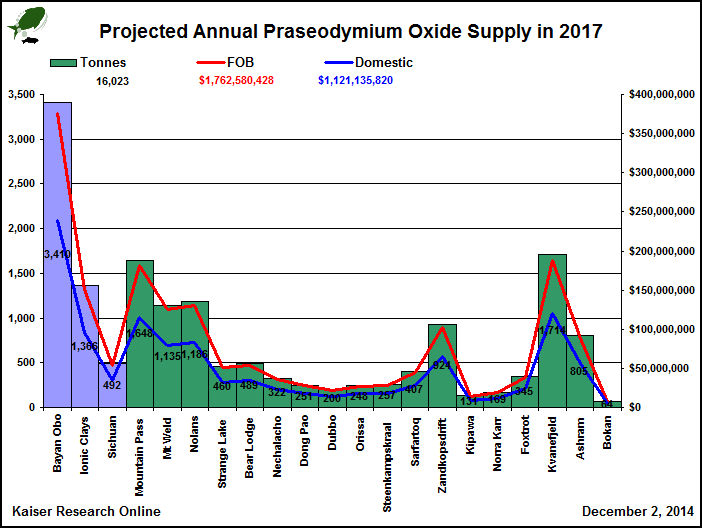
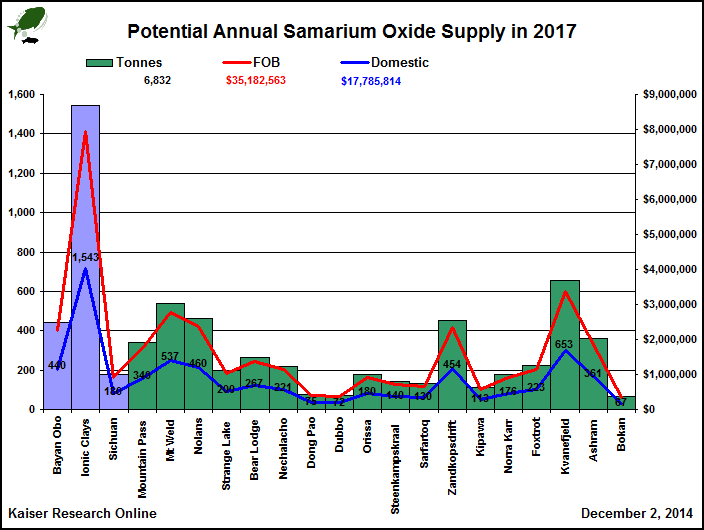
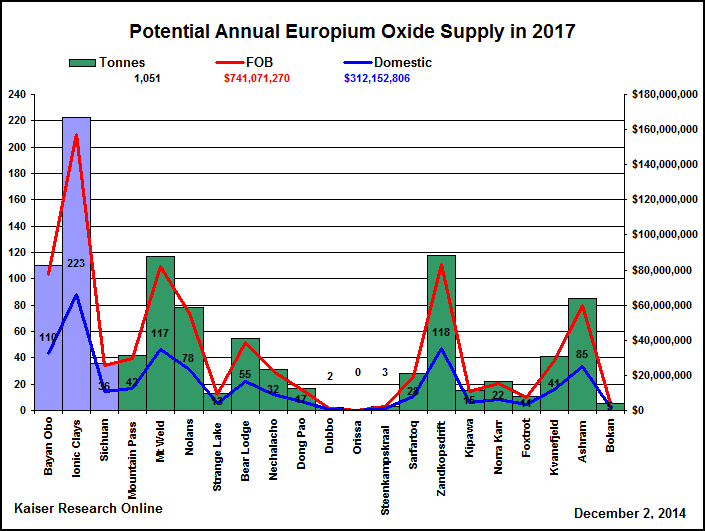
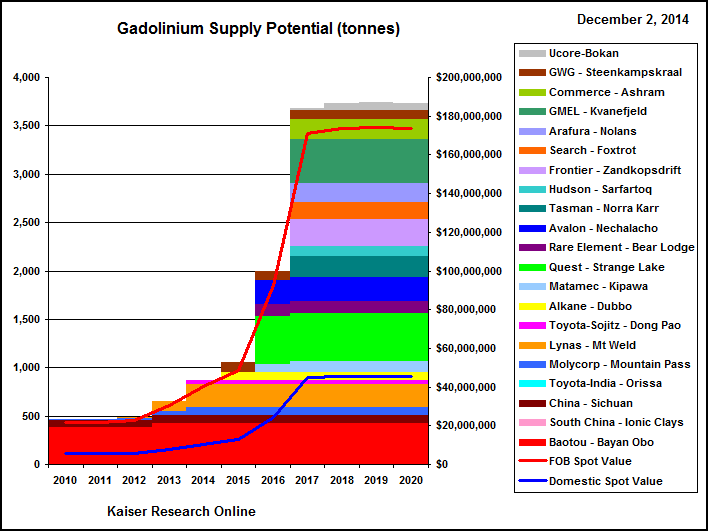
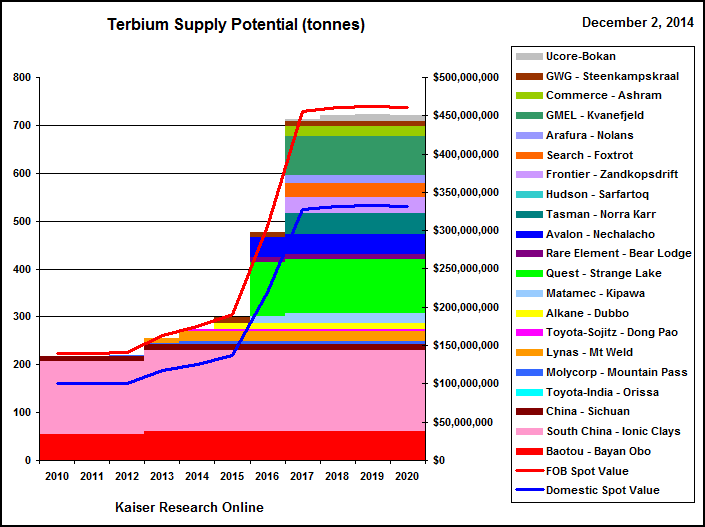
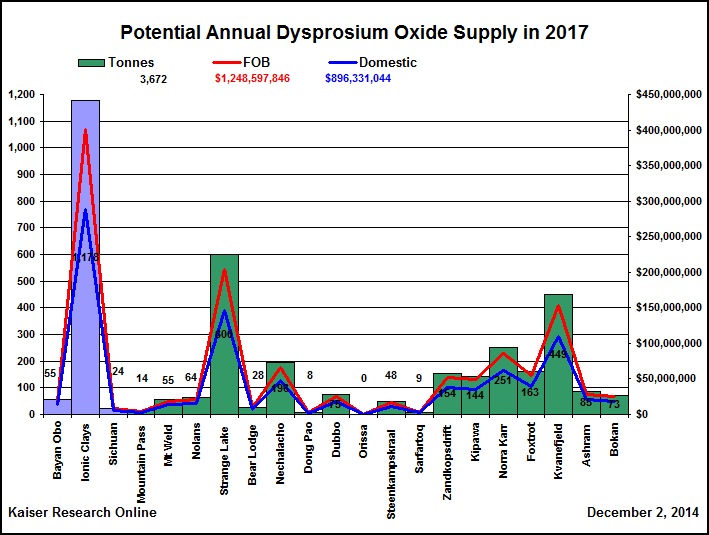
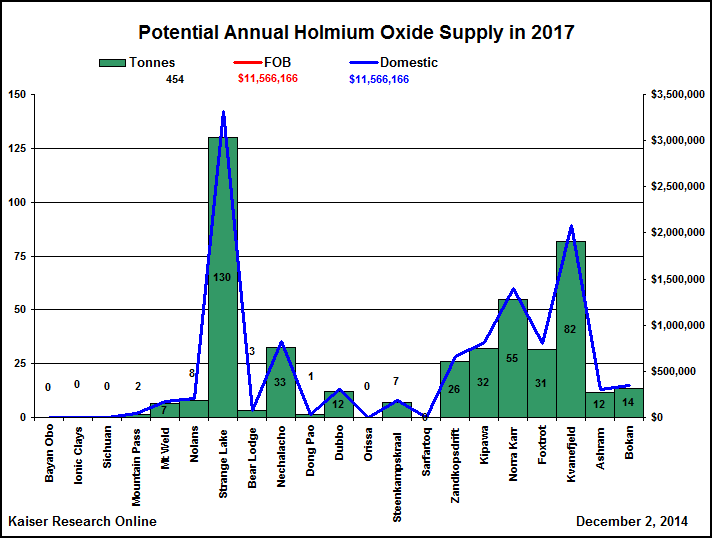
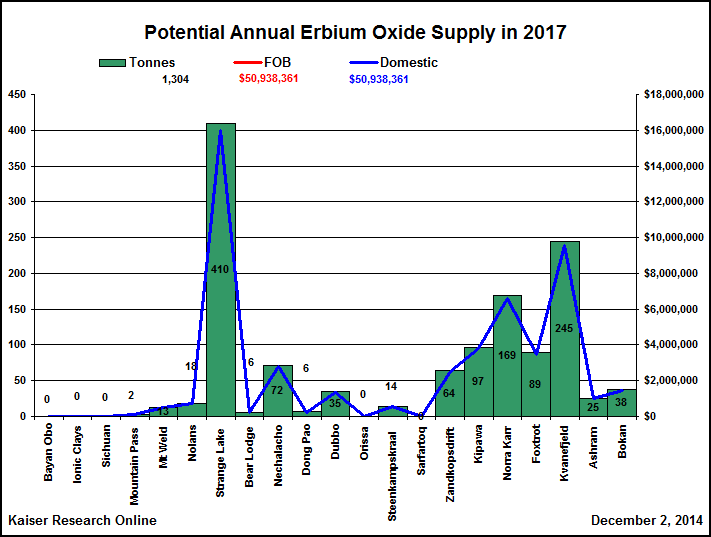
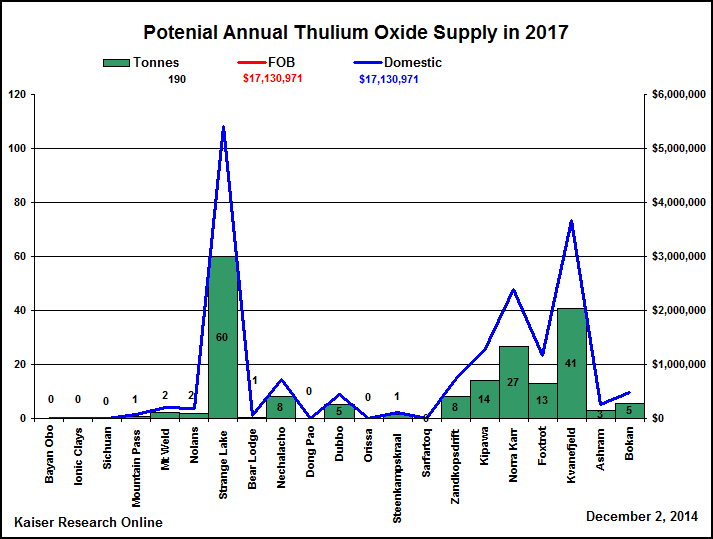
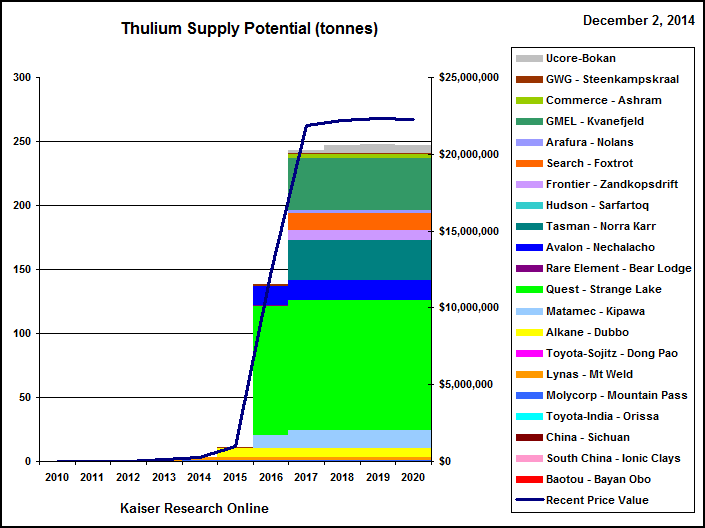
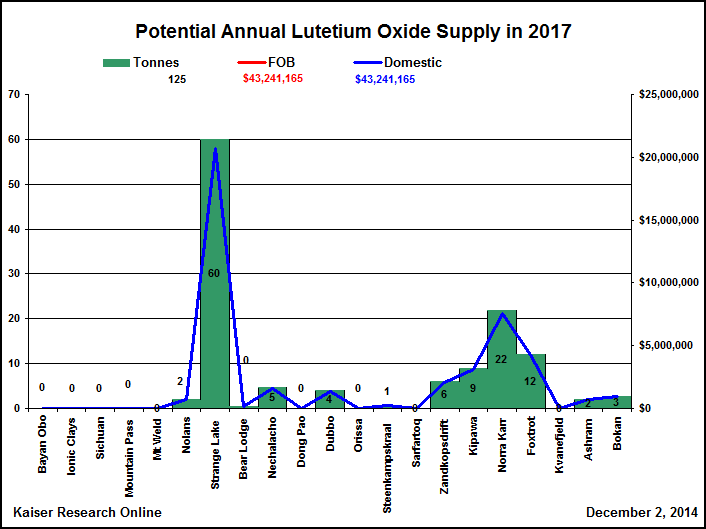
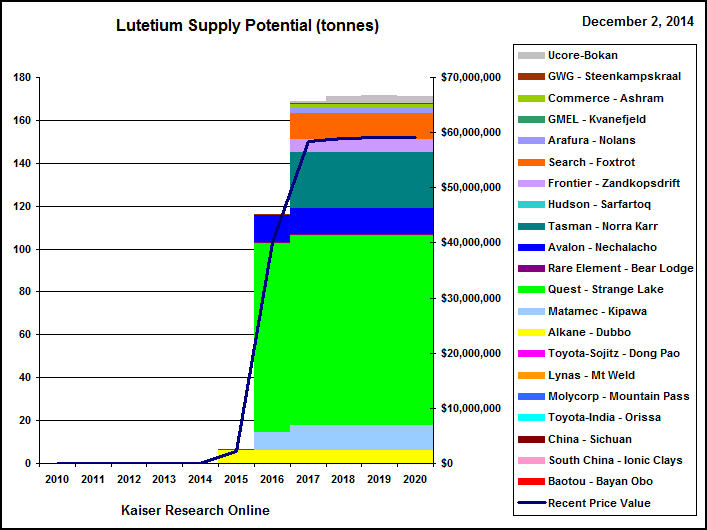
The following batch of charts projects supply for the individual rare earth oxides in two formats. One chart presents supply in 2016 according to individual operations, maintaining the same order as the total rare earth supply chart. The other chart presents the supply evolution from 2010-2020 for that individual rare earth. We have extracted the individual rare earth supply by applying the published REO distribution for each project to that company's planned total rare earth output. Where the company has indicated that it will not try to recover the minor elements, as is generally the case with the light rare earth skewed deposits, we have assigned zero recovery to those elements. In other cases such as Avalon's Nechalacho where the company has indicated that the rare earths will be uniformly recovered, we have applied the natural distribution to the projected total rare earth output. Our model is set up to specify individual rare earth recoveries and we will apply such recoveries if they are published by a company.
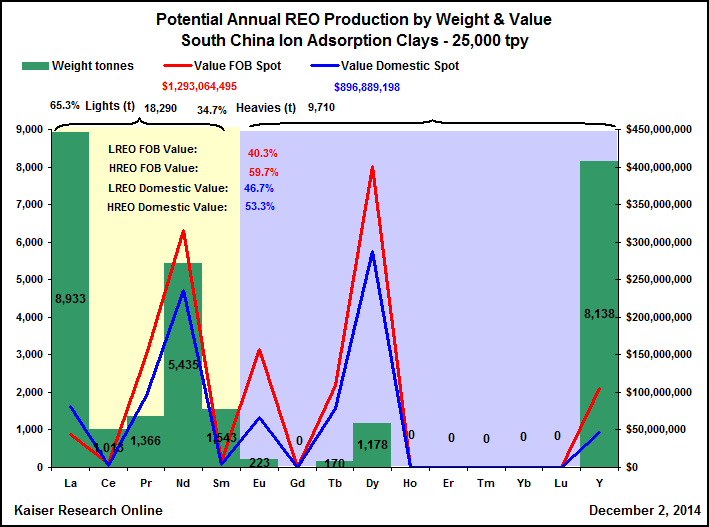
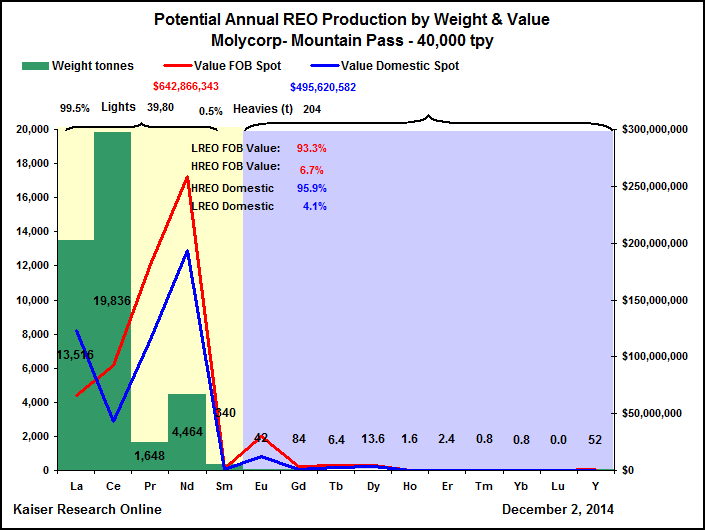
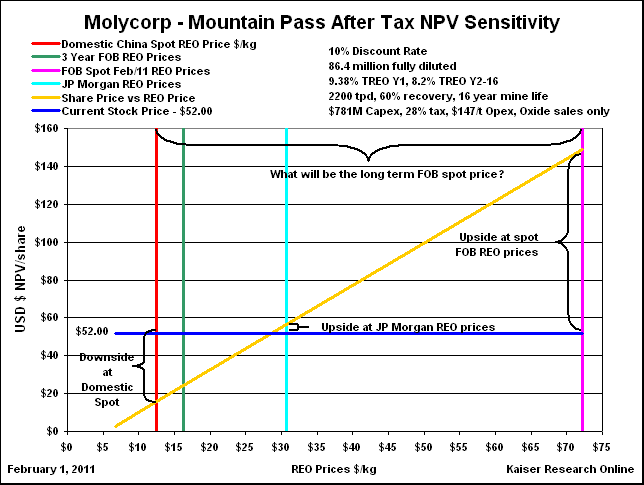
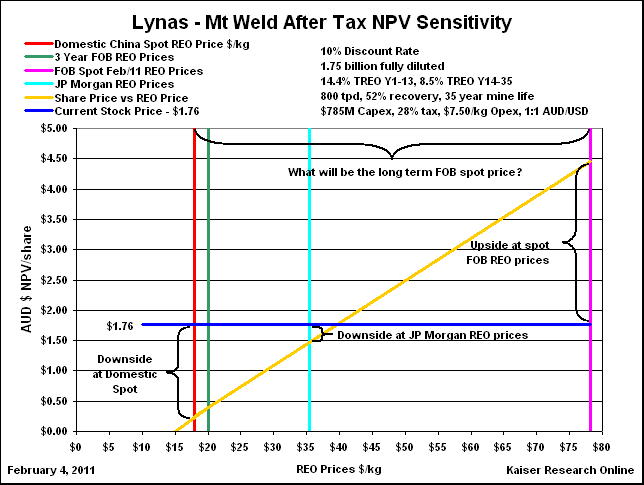
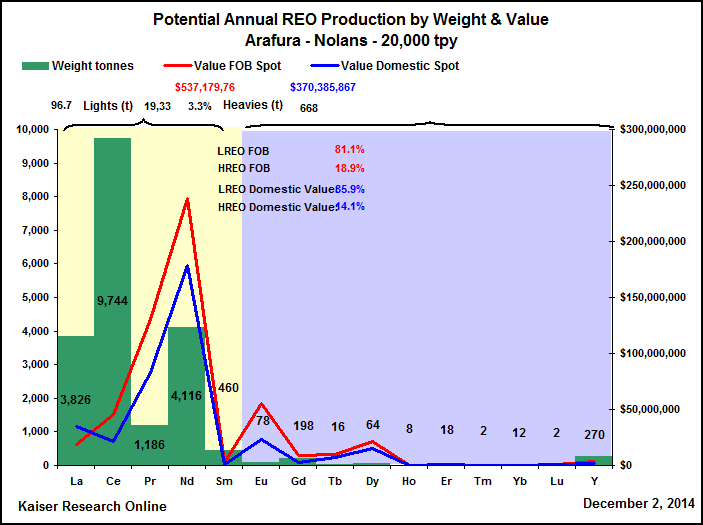
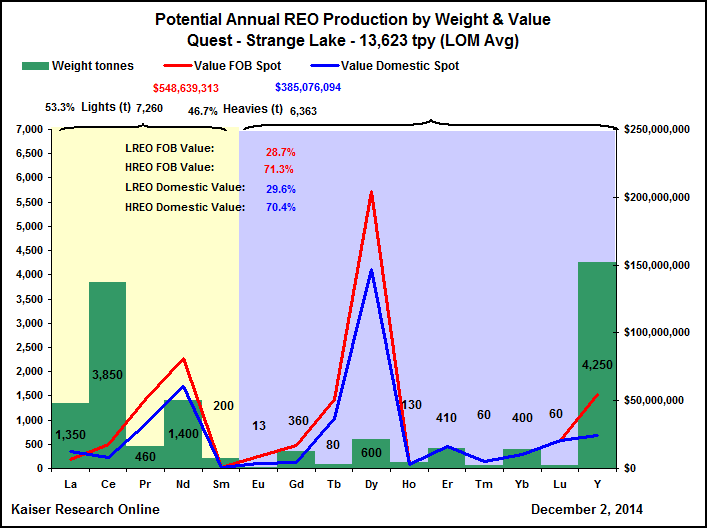
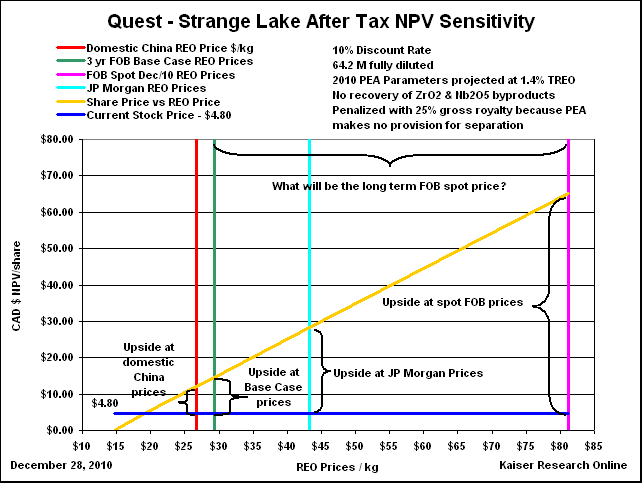
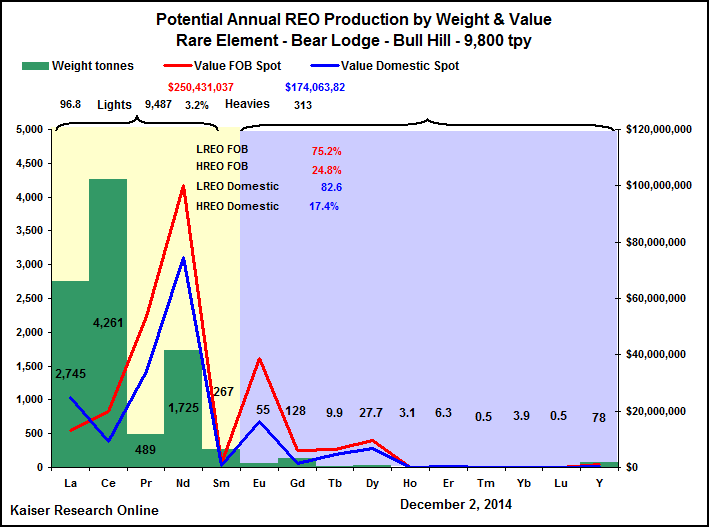
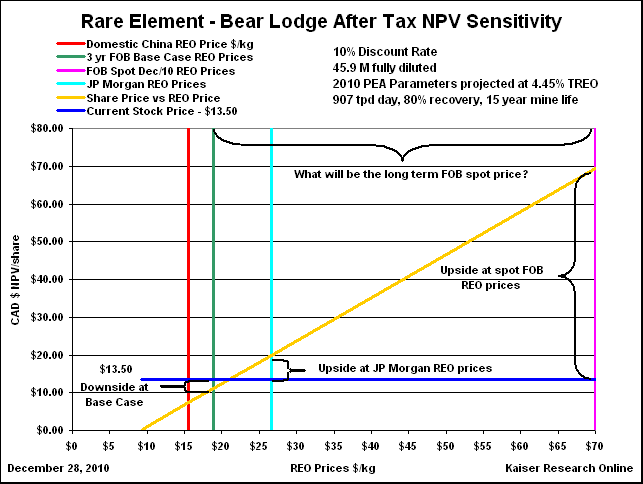
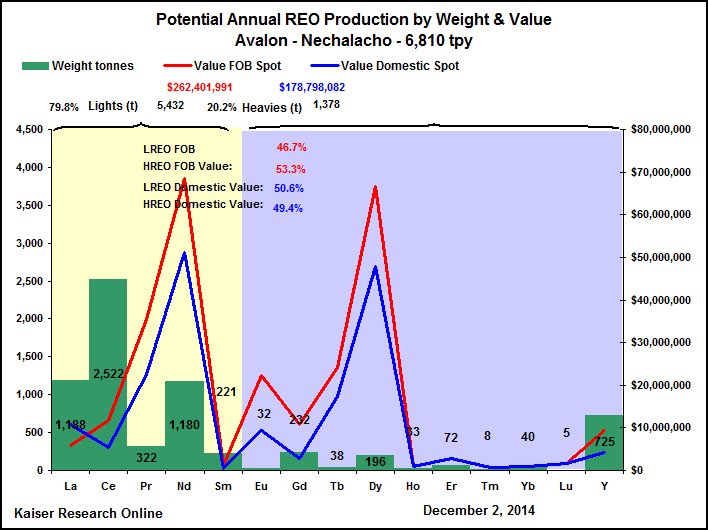
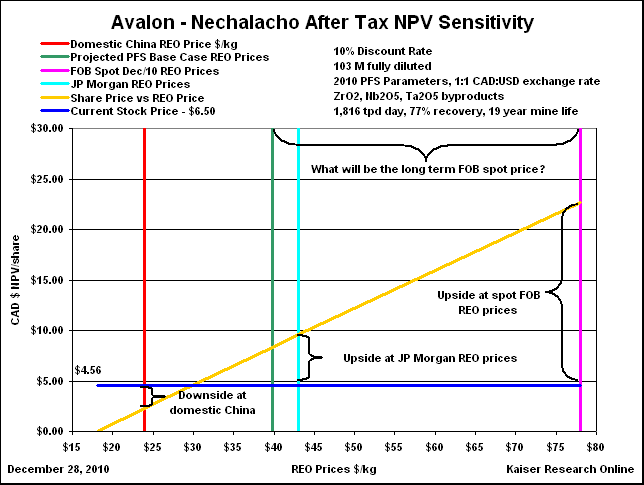
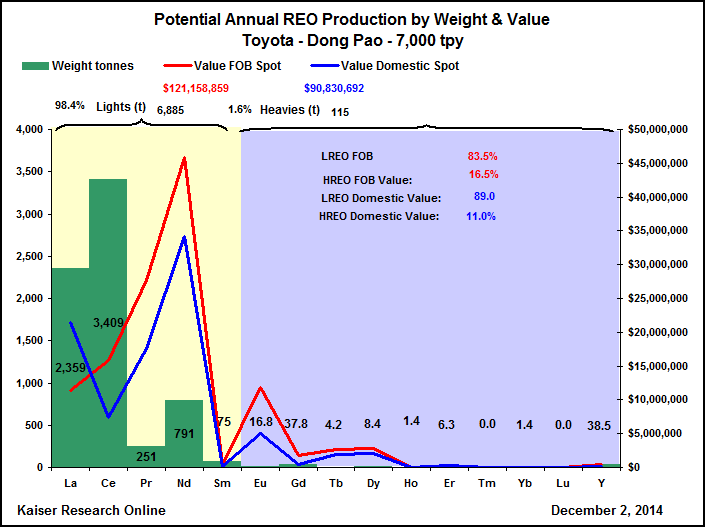
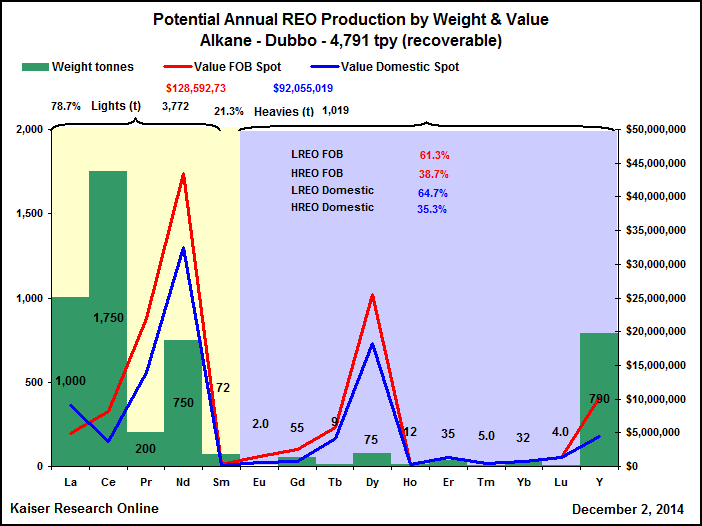
In the final batch of charts we show how the individual rare earth supply breaks down in tonnage and value terms for each of the projects in our supply projection. We also include the chart for the after-tax sensitivity analysis we may have done for the proposed operation using the different REO price sets. Note that the date on these graphs may be older. We also include GMEL's Kvanefjeld so that we can see what the supply breakdown for that project would look like if permitting becomes a possibility. These charts have yellow and lavender backgrounds to make it easy to identify light (La Ce Pr Nd Sm) and heavy (Eu Gd Tb Dy Ho Er Tm Yb Y) rare earth oxides. We think the distinction is somewhat over-blown and muddied by varying definitions. Certain deposits, however, have a fuller spectrum of rare earths than others, and these charts make it easy to see which projects are better suited to serve "heavy" rare earth demand growth.
In the case of the South China ion adsorption clays, we have calculated a composite distribution by applying the known distributions for Bayan Obo and Sichuan to their reported production, subtracting that from the 2006 reported Chinese production for individual rare earths, and extracting the distribution from the remainder. The ion adsorption clay deposits do not have uniform distributions and in some cases do not match the natural relative distributions seen in rare earth bearing carbonatite and peralkaline rocks. The crackdown on illegal and polluting mines now underway in southern China will no doubt change the historical supply structure of this region and we acknowledge that the South China supply projection has a higher degree of uncertainty than our supply projections for specific bedrock deposits.
The rare earth sector is hideously complicated, and while we have tried our best to assemble reliable data and accurately input them into our spreadsheet, be forewarned that errors may be present. We appreciate hearing about anything that may be wrong.



















|