Home / Research Tools
Research Tools
| | Corporate Profile: Zazu Metals Corp
Publisher: Kaiser Research Online
Author: Copyright 2009 John A Kaiser
|
| |
Zazu Metals Corp (ZAZ-V)
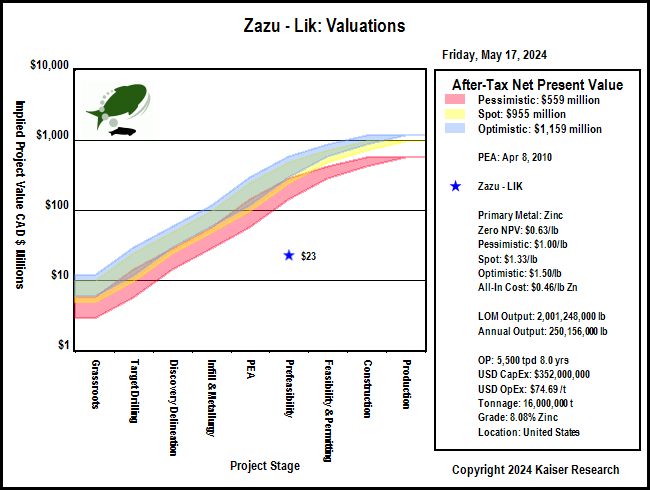
| Zazu Metals was formed to advance the LIK zinc-lead-silver property in the Red Dog District of Alaska, where the company owns 50% and is earning up to 80% of this Teck Resources-controlled deposit. The Lik deposit is located in northwest Alaska, 22 kilometres from Teck's Red Dog mine, the world's largest zinc producer and has a May, 2009 43-101 compliant mineral resource estimate of 20.6 million tons, grading 8.08 per cent zinc, 2.62 per cent lead and 1.54 ounces of silver per ton in the indicated category for the Lik South deposit and 7.07 million tons grading 9.1 per cent zinc, 3.03 per cent lead and 1.39 ounces of silver per ton in the inferred category for the Lik North and Lik South deposits, representing over 3.3 billion pounds of zinc, over one billion pounds of lead and over 31 million ounces of silver in Lik South. Lik North contains nearly 1.3 billion pounds of zinc, 500 million pounds of lead and nearly 10 million ounces of silver. The company is led by CEO and President Gil Atzmon. In November 2013 a PEA was initiated, with results expected during Q1, 2014. |

Key to Understanding IPV Charts and Spec Value Hunter Tables
| An IPV Chart is a graphical presentation of a Spec Value Hunter table that has been constructed according to the Rational Speculation Model developed by John Kaiser. The IPV Chart allows speculators to identify which projects offer poor, fair or good speculative value in both absolute and relative terms. The speculative value depends on the project stage, the project's implied value as calculated by the company's fully diluted capitalization, stock price and net project interest, and the dream target deemed appropriate for the project. A dream target is what a project would be worth in discounted cash flow terms once in production. |
| Green background indicates the dream target judged appropriate for this play by John Kaiser - otherwise unranked. |
Poor Speculative Value -   |
Fair Speculative Value -  |
Good Speculative Value -   |
| Note: narrow arrows indicate IPV is outside the fair value channel but within 25% of the fair value limits |
| Click on the company name to view the company profile, the project name to view project details. |
| Click on the project icon if its background is shaded to get the IPV Chart for that company. |
| LIK |  | 80% WI | United States | 6-Prefeasibility |
|---|
| Lik 43-101 Economic Study (USD except where noted otherwise) |
| PEA | Mar 3, 2014 |
| JDS Energy | Lik |
| Mining Scenario | TR | Mining Costs |
| Mining Type: | OP |
| Cost Currency: | USD |
| Processing Type: |
|
| Capital Cost: | $324,700,000 |
| Operating Rate: | 5,500 tpd |
| Sustaining Cost: | $27,000,000 |
| Operating Days: | 365 |
| Operating Cost: | $67.66/t |
| Strip Rate: |
|
| BC Cash Cost per Unit: USD | $0.58/lb Zn |
| Mine Life: | 9 years |
| BC Cash Cost Net By-Products: USD | $0.27/lb Zn |
| LOM Tonnage: | 17,100,000 t |
| BC All-In Cost Net By-Prod: USD | $0.44/lb Zn |
| Est Startup: |
|
| Spot All-In Cost Net By-Prod: USD | $0.43/lb Zn |
| Production Potential |
| Metal 1 | Metal 2 | Metal 3 | Metal 4 |
| Metal: | Zn | Pb | Ag |
|
| Grade: | 7.70% | 2.60% | 47.00 g/t |
|
| Recovery: | 85.0% | 69.7% | 32.0% |
|
| Annual Output: | 232,249,326 lb | 70,899,248 lb | 107,393 oz |
|
| LOM Output: | 2,090,243,935 lb | 638,093,232 lb | 966,541 oz |
|
| Base Case Price: | $0.92/lb | $1.01/lb | $19.43/oz |
|
| Spot Price: | $1.37/lb | $1.03/lb | $16.47/oz |
|
| Base Case NSR: | $106.44/t | $35.67/t | $1.04/t |
|
| Spot NSR: | $158.50/t | $36.38/t | $0.88/t |
|
| Base Case Valuation |
| Reported Valuation Currency: | USD |
| Pre-Tax NPV: | $69,000,000 |
| Discount Rate: | 8% |
| After-Tax NPV: | $25,000,000 |
| Total Base Case NSR USD: | $143.15/t |
| Pre-Tax IRR: | 13% |
| Total Spot NSR USD: | $195.75/t |
| After-Tax IRR: | 10% |
| Annual Pre-Tax Cash Flow Base Case and Net CF/FDSH USD: | $151,536,816 | $1.97 | Pre-Tax Payback: | 5.0 y |
| Annual Pre-Tax Cash Flow Spot and Net CF/FDSH USD: | $257,149,115 | $3.37 | After-Tax Payback: | 5.8 y |
| Enterprise Value CAD : | $18,172,085 | $.30/sh | Share Price: | $0.30 |
| Note: |
| Comparative Valuations using Life of Mine Averages |
| Discount Rate: | 0% | 5% | 10% | 15% |
| Base Case Pre-Tax NPV USD: | $1,012,131,348 | $696,260,193 | $482,479,148 | $333,961,639 |
| Base Case Pre-Tax Net NPV/Sh USD: | $13.41 | $9.22 | $6.39 | $4.42 |
| Premium BC PT NPV over EV: | $13.17 | $8.99 | $6.16 | $4.19 |
| Spot Pre-Tax NPV USD: | $1,962,642,033 | $1,411,187,226 | $1,035,409,823 | $772,168,547 |
| Spot Pre-Tax Net NPV/Sh: | $26.00 | $18.69 | $13.72 | $10.23 |
| Premium Spot PT NPV over EV USD: | $25.77 | $18.46 | $13.48 | $10.00 |
| The comparative NPV calculations assume constant annual cash flow based on the life of mine average annual payable production and CapEx spent in year one. The operating cost includes the LOM sustaining capital. Due to details such as ore scheduling these NPV figures may differ from those of the 43-101 economic study. |
| After-Tax Valuations using Spot By-Product Prices |
 |
 |
| Lik 43-101 Economic Study (USD except where noted otherwise) |
| PEA | Apr 8, 2010 |
| Scott Wilson RPA | Lik |
| Mining Scenario | TR | Mining Costs |
| Mining Type: | OP |
| Cost Currency: | USD |
| Processing Type: |
|
| Capital Cost: | $352,000,000 |
| Operating Rate: | 5,500 tpd |
| Sustaining Cost: | $48,000,000 |
| Operating Days: | 365 |
| Operating Cost: | $74.69/t |
| Strip Rate: | 5.0 |
| BC Cash Cost per Unit: USD | $0.60/lb Zn |
| Mine Life: | 8 years |
| BC Cash Cost Net By-Products: USD | $0.34/lb Zn |
| LOM Tonnage: | 16,000,000 t |
| BC All-In Cost Net By-Prod: USD | $0.54/lb Zn |
| Est Startup: |
|
| Spot All-In Cost Net By-Prod: USD | $0.47/lb Zn |
| Production Potential |
| Metal 1 | Metal 2 | Metal 3 | Metal 4 |
| Metal: | Zn | Pb | Ag |
|
| Grade: | 8.08% | 2.57% | 51.60 g/t |
|
| Recovery: | 83.0% | 70.0% | 26.9% |
|
| Annual Output: | 250,156,000 lb | 75,016,375 lb | 280,085 oz |
|
| LOM Output: | 2,001,248,000 lb | 600,131,000 lb | 2,240,683 oz |
|
| Base Case Price: | $1.00/lb | $0.80/lb | $16.00/oz |
|
| Spot Price: | $1.37/lb | $1.03/lb | $16.47/oz |
|
| Base Case NSR: | $124.61/t | $29.89/t | $2.23/t |
|
| Spot NSR: | $170.72/t | $38.49/t | $2.30/t |
|
| Base Case Valuation |
| Reported Valuation Currency: | USD |
| Pre-Tax NPV: | $19,000,000 |
| Discount Rate: | 8% |
| After-Tax NPV: |
|
| Total Base Case NSR USD: | $156.74/t |
| Pre-Tax IRR: | 9% |
| Total Spot NSR USD: | $211.50/t |
| After-Tax IRR: |
|
| Annual Pre-Tax Cash Flow Base Case and Net CF/FDSH USD: | $164,710,285 | $2.10 | Pre-Tax Payback: |
|
| Annual Pre-Tax Cash Flow Spot and Net CF/FDSH USD: | $274,653,411 | $3.56 | After-Tax Payback: |
|
| Enterprise Value CAD : | $18,172,085 | $.30/sh | Share Price: | $0.30 |
| Note: 2.5% NSR |
| Comparative Valuations using Life of Mine Averages |
| Discount Rate: | 0% | 5% | 10% | 15% |
| Base Case Pre-Tax NPV USD: | $917,682,280 | $641,693,656 | $449,734,234 | $313,203,544 |
| Base Case Pre-Tax Net NPV/Sh USD: | $12.16 | $8.50 | $5.96 | $4.15 |
| Premium BC PT NPV over EV: | $11.92 | $8.27 | $5.72 | $3.92 |
| Spot Pre-Tax NPV USD: | $1,797,227,290 | $1,318,442,053 | $982,951,020 | $742,203,678 |
| Spot Pre-Tax Net NPV/Sh: | $23.81 | $17.47 | $13.02 | $9.83 |
| Premium Spot PT NPV over EV USD: | $23.58 | $17.23 | $12.79 | $9.60 |
| The comparative NPV calculations assume constant annual cash flow based on the life of mine average annual payable production and CapEx spent in year one. The operating cost includes the LOM sustaining capital. Due to details such as ore scheduling these NPV figures may differ from those of the 43-101 economic study. |
| After-Tax Valuations using Spot By-Product Prices |
 |
 |
|
| |
| | You can return to the Top of this page
|
|