Home / Companies / KRO Focus
KRO Focus
| Outcome Visualization Project as of Apr 25, 2024: Canalaska:- West McArthur as McArthur River Clone |
| Project: | West McArthur | Location: | Canada | Stage: | 3-Discovery Delineation |
| Net Interest: | 83.3% WI | Uncapped NSR: | 8.3% | Target Metals: | Uranium |
| OV Project ID: | 1000009 | OVP Posted: | 5/17/2016 | OVP Retired: |
|
| Current OV ID: | 1000035 | Current OV Confirmed: | 3/8/2024 | Visualizer: | JK |
Issued
153,618,000 |
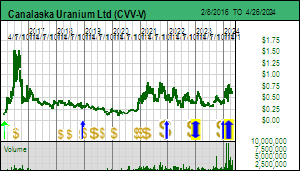
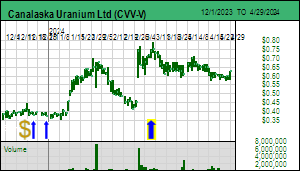
Price
$0.600 |
Working Capital
$15,076,000 |
Key People: Cory Belyk (CEO), Thomas Jr Graham (Chair), Harry Chan (CFO), Nathan Bridge (VP EX), Dianne M. Szigety (Sec), |
Diluted
212,149,000 |
Insiders
3.0% |
As of
1/31/2024 |
 |  |
| Visualized Outcome: Canalaska - West McArthur as McArthur River Clone |
| Canalaska Uranium Ltd announced a basement hosted intersection on July 15, 2022 while testing a conductor southwest of the 42 Zone which has sandstone hosted mineralization related to the structure that hosts the Fox Lake zone owned by Cameco and Orano. The Fox Lake deposits are about 400,000 tonnes of 7.99% U3O8. An OV created for West McArthur in 2016 visualized a McArthur River clone and used costs provided by Cameco in a 2012 43-101 report. McArthur River is mined at only 200 tpd because it is about 1 million tonnes of 16% and located at the unconformity which creates difficult mining conditions that entail very high costs. In February 2024 Canalaska announced a substantial very high grade intersection at the unconformity after struggling during 2023 to define the geometry of the basement hosted mineralization encountered in 2022. The unconformity intersection will simplify delineation drilling of what may prove to be a "string of pearls" similar to the McArthur egress-style zones. This OV has been updated with an across the board 25% cost escalation of the costs used in 2016. |
| Source Note: The costs used in the original 2016 OV were based on CAD costs used by Cameco for Cigar Lake and McArthur River. For the 2024 OV update all costs have been increased by 25%. |
| Visualized Outcome Summary: Canalaska - West McArthur as McArthur River Clone |
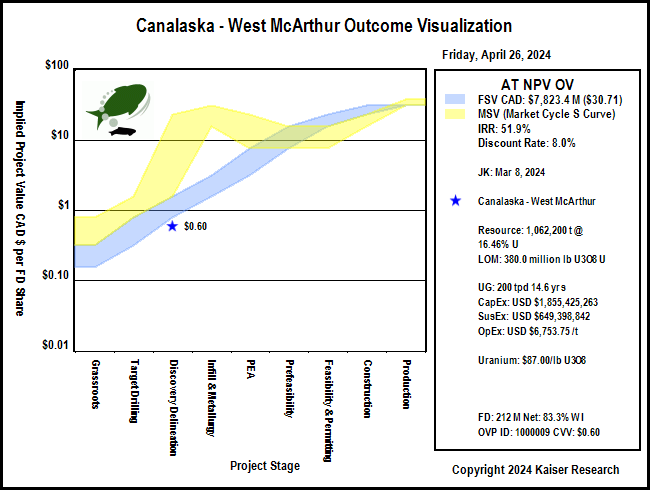
| Deposit Scenario: 1,062,200 t @ 16.46% Uranium |
| Mining Scenario: Underground 200 tpd 14.6 yrs, CapEx $1.9 billion, SustCapEx $649.0 million, OpEx $6,753.75/t (USD) |
| LOM Payable: 380.0 million lb U3O8 uranium |
| Economic Outcome (USD): Revenue Model at OV designated Metal Prices |
| Annual Average | Life of Mine (LOM) | LOM Stats |
| Recoverable Revenue: | $2,274,672,616 | $33,098,044,561 | $31,160/t ore Recoverable Value: |
| Smelter/Transport Costs: | ($8,013,825) | ($116,606,642) | 0.4% of Recoverable Revenue |
| Gross Payable Revenue: | $2,266,658,791 | $32,981,437,918 | 99.6% of Recoverable Revenue |
| Royalties: | ($186,999,350) | ($2,720,968,628) | 8.3% of Gross Payable Revenue |
| Net Payable Revenue: | $2,079,659,441 | $30,260,469,290 | 91.4% of Recoverable Revenue |
| Mining Cost: | ($239,973,702) | ($3,491,781,723) | 45% of OpEx - $3,287.31/t ore |
| Processing Cost: | ($213,309,957) | ($3,103,805,976) | 40% of OpEx - $2,922.05/t ore |
| Other Cost: | ($31,996,494) | ($465,570,896) | 6% of OpEx - $438.31/t ore |
| Sustaining Cost: | ($42,613,290) | ($639,199,357) | 8% of OpEx - $601.77/t ore |
| Total Operating Cost: | ($528,404,000) | ($7,707,786,907) | 25% of Net Payable Revenue - OpEx - $7,256.44/t ore |
| Pre-Tax Cash Flow: | $1,551,255,441 | $22,552,682,383 | 75% of Net Payable Revenue - $21,232.05/t ore |
| Taxes: | ($598,812,294) | ($8,705,087,372) | 39% of Pre-Tax Cash Flow - $8,195.34/t ore
|
| After-Tax Cash Flow: | $952,443,147 | $13,847,595,011 | 46% of Net Payable Revenue - $13,036.71/t ore |
| Note: Concentrate transport costs, smelter treatment costs and retention are subtracted from recoverable revenue to get gross payable revenue to which the uncapped royalty rate for the project is applied. The annual average of LOM sustaining cost is expensed as an annual operating cost. Annual average figures reflect full production years. |
| Economic Outcome (USD): Royalty Model for 1% NSR at OV designated Metal Prices |
| Mine Life: | 15 years | Startup | NPV 5% | NPV 10% | NPV 15% |
| Annual Avg NSR: | $20,796,594 | Now | $201,301,721 | $141,766,925 | $104,745,244 |
| LOM NSR: | $302,604,693 | 2030 | $150,214,444 | $80,023,733 | $45,284,260 |
| Economic Outcome - Discount Rate: 8.0% - CAD AT NPV: $7.8 billion - Good Speculative Value |
| Gross Rock Value (USD/t): | $31,570 | Recoverable Rock Value: | $31,160 | Payable Rock Value: | $31,050 |
| LOM Net Payable Revenue (USD): | $30,260,469,290 | LOM PT Cash Flow (USD): | $22,552,682,383 | LOM AT Cash Flow (USD): | $13,847,595,011 |
| USD Pre-Tax NPV: | $10,394,346,209 | Pre-Tax IRR: | 84.9% | Pre-Tax Payback: | 1.2 |
| USD After-Tax NPV: | $5,729,375,351 | After-Tax IRR: | 52.0% | After-Tax Payback: | 1.9 |
| CAD Fair Spec Value Low: | $196,073,548 | CAD Fair Spec Value High: | $392,147,096 | CAD Implied Project Value: | $152,826,750 |
| Price Target if Visualized Outcome delivered by Expl-Dev Cycle without dilution: CAD $30.79 |
 |
| Fair Speculative Value Stock Price Range: CAD $0.77 - $1.54 |
| MSV (Market Cycle S Curve): Market Speculative Value represents the typical market pricing pattern of a new discovery as it moves through its exploration-development cycle. The irrational pricing behavior of the yellow channel contrasts with the fair speculative value of the blue channel as defined by the rational speculation model because during the pre-economic study stages there is great uncertainty about how big the discovery will turn out. |
Fair Speculative Value Ladder
| USD OV NPV | CAD OV NPV | Exch Rate | Diluted | Net Interest |
|---|
| $5,729,375,351 | $7,842,941,918 | 1.3689 | 212,149,000 | 83.29% |
|---|
| Project Stage | Uncertainty Range | CAD FSV Range | CAD FSV per Share Range | CAD MSV per Share Range |
|---|
| Grassroots |
0.5% - 1.0% |
$39,214,710 - $78,429,419 |
$0.15 - $0.31 |
$0.31 - $0.77 |
| Target Drilling |
1.0% - 2.5% |
$78,429,419 - $196,073,548 |
$0.31 - $0.77 |
$0.77 - $1.54 |
| Discovery Delineation |
2.5% - 5.0% |
$196,073,548 - $392,147,096 |
$0.77 - $1.54 |
$1.54 - $23.09 |
| Infill & Metallurgy |
5% - 10% |
$392,147,096 - $784,294,192 |
$1.54 - $3.08 |
$15.40 - $30.79 |
| PEA |
10% - 25% |
$784,294,192 - $1,960,735,480 |
$3.08 - $7.70 |
$7.70 - $23.09 |
| Prefeasibility |
25% - 50% |
$1,960,735,480 - $3,921,470,959 |
$7.70 - $15.40 |
$7.70 - $15.40 |
| Permitting & Feasibility |
50% - 75% |
$3,921,470,959 - $5,882,206,439 |
$15.40 - $23.09 |
$7.70 - $15.40 |
| Construction |
75% - 100% |
$5,882,206,439 - $7,842,941,918 |
$23.09 - $30.79 |
$15.40 - $23.09 |
| Production |
100% |
$7,842,941,918 |
$30.79 |
$30.79 - $38.49 |
 |
| Market Speculative Value Stock Price Range: CAD $1.54 - $23.09 |
| Warning: while the market spec value (S-Curve) and fair spec value channels presented in project value terms track the evolving expected ultimate outcome value, when presented in stock price terms the expected stock prices are subject to dilution through future equity financings or project interest farmouts. |
| Alternative Metal Price Scenarios |
| Metal 1 | Metal 2 | Metal 3 | Metal 4 |
| Uranium |
|
|
|
| Spot: | $87.00 /lb U3O8 |
|
|
| | OV Assigned: | $87.00 /lb U3O8 |
|
|
| | Pessimistic: | $50.00 /lb U3O8 |
|
|
| | Optimistic: | $125.00 /lb U3O8 |
|
|
| | Fantasy: | $200.00 /lb U3O8 |
|
|
| | Note: for Metal 1 pessimistic, optimistic and fantasy price scenarios, OV assigned prices are used for Metals 2-4 |
| Economic Outcomes with Alternative Metal Price Scenarios |
| USD PT NPV | USD PT IRR | USD AT NPV | USD AT IRR | AT Payback yrs |
| Spot: | $10,394,346,209 | 84.9% | $5,729,375,351 | 52.0% | 1.9 |
| OV Assigned: | $10,394,346,209 | 84.9% | $5,729,375,351 | 52.0% | 1.9 |
| Pessimistic: | $3,476,289,140 | 35.9% | $1,716,902,251 | 22.7% | 4.2 |
| Optimistic: | $17,499,377,794 | 134.9% | $9,850,293,671 | 81.1% | 1.2 |
| Fantasy: | $31,522,466,449 | 233.4% | $17,983,685,090 | 138.2% | 0.7 |
| Fair Speculative Value for Alternative Metal Price Scenarios |
| Stage: Discovery Delineation - 2.5% - 5.0% |
| CAD AT NPV | CAD Target Price | CAD FSV Range | CAD FSV per Share Range | CAD MSV per Share Range |
| Spot: | $7,842,941,918 | $30.79 | $196,073,548 - $392,147,096 | $0.77 - $1.54 | $1.54 - $23.09 |
| OV Assigned: | $7,842,941,918 | $30.79 | $196,073,548 - $392,147,096 | $0.77 - $1.54 | $1.54 - $23.09 |
| Pessimistic: | $2,350,267,491 | $9.23 | $58,756,687 - $117,513,375 | $0.23 - $0.46 | $0.46 - $6.92 |
| Optimistic: | $13,484,067,006 | $52.94 | $337,101,675 - $674,203,350 | $1.32 - $2.65 | $2.65 - $39.70 |
| Fantasy: | $24,617,866,520 | $96.65 | $615,446,663 - $1,230,893,326 | $2.42 - $4.83 | $4.83 - $72.49 |
| Disclaimer: A visualized outcome is one of many possible outcomes for an exploration project as it moves through the 9 stages of the exploration-development cycle from grassroots to a producing mine with failure as an outcome at any point along the way. The range of possible outcomes for the physical nature of a deposit shrinks after delivery of an initial 43-101 resource estimate. While the nature of the deposit constrains the range of mining scenarios, the cost assumptions will vary as the project moves through the feasibility demonstration stages of the cycle, which affects the economic value of the final outcome. This economic value will also vary according to the prices of the metals targeted for extraction which may change during the years it takes for a project to become a mine. An outcome visualization is thus a compilation of best guess assumptions for the key variables that drive the discounted cash flow model, the basis for assigning an economic value to a mine. An OV is not intended as a prediction, but rather as a framework that allows the incorporation of new information generated by the exploration-development cycle for the project into a valuation model on an ongoing, dynamic basis. |
.
|