| |
Etruscan Resources Inc (EET-T)
| Etruscan Resources is a West Africa-focused junior producer founded by Gerald McConnell and controlled by Frank Giustra's Endeavour Financial since October 2009 when Endeavour invested $43 million. Etruscan, whose flagship Youga Gold Mine in Burkina-Faso achieved commercial production in July 2008, had ended up in financial trouble as a result of a $35 million loan facility requirement in 2007 to hedge the first 5 years of production. Half of the projected 456,102 ounces of production was hedged at $700; the Endeavour financing enabled Etruscan to reduce its hedge book by 62,200 ounces, leaving only 82,300 ounces (20%) of anticipated life-of-mine production hedged. 90% owned Youga is an open pit mining operation with a 2,700 tpd mill expected to produce 80,000 ounces gold per year. Etruscan is also exploring the Ouare project which has a resource of 315,000 ounces at 2.2 g/t gold. Etruscan is awaiting a mining permit for its 85% owned Agbao gold project in Cote d'Ivoire which has an open pittable resource of 665,000 ounces gold at 2.1 g/t. While waiting for the permit Etruscan plans to conduct additional infill and condemnation drilling in 2010. Etruscan also has a 40% carried interest in the Finkolo gold project in mali which is operated by Resolute Mining. The Tabakoroni deposit has a resource of 610,00 ounces at 2.78 g/t gold. In 2010 Etrusan decided to float its rare earth projects in Namibia into a separate company called Namibia Rare Earths Inc which is expected to complete an IPO by the end of the year. The Lofdal project is a carbonatite system with a significant distribution of the heavy rare earth elements. In June 2010 Endeavour Financial announced plans to acquire the 45% of Etruscan it did not own, at a price of $0.48 per share comprised of 26 cents in cash plus 0.0932 of an Endeavour share. |
Key to Understanding IPV Charts and Spec Value Hunter Tables
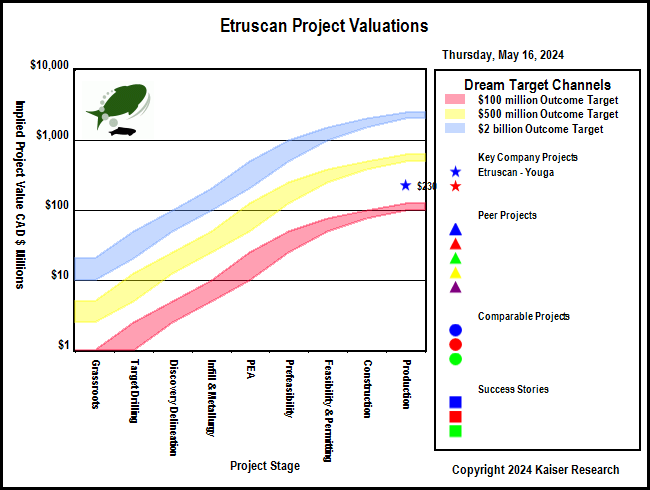
| An IPV Chart is a graphical presentation of a Spec Value Hunter table that has been constructed according to the Rational Speculation Model developed by John Kaiser. The IPV Chart allows speculators to identify which projects offer poor, fair or good speculative value in both absolute and relative terms. The speculative value depends on the project stage, the project's implied value as calculated by the company's fully diluted capitalization, stock price and net project interest, and the dream target deemed appropriate for the project. A dream target is what a project would be worth in discounted cash flow terms once in production. |
| Green background indicates the dream target judged appropriate for this play by John Kaiser - otherwise unranked. |
Poor Speculative Value -   |
Fair Speculative Value -  |
Good Speculative Value -   |
| Note: narrow arrows indicate IPV is outside the fair value channel but within 25% of the fair value limits |
| Click on the company name to view the company profile, the project name to view project details. |
| Click on the project icon if its background is shaded to get the IPV Chart for that company. |
Etruscan Project Valuations
| Company | Project | Country | Stage | IPV $
MM |
$100 | UPV
$500 |
$2000 | Target Metals | Deposit Style |
| Key Company Projects |
 |
Etruscan Resources Inc (EET-T) | Youga |  | Burkina Faso | Production |
$230 | | |
| Gold | Sediment Hosted |
|
|
| Peer Projects |
|
|
|
|
|
|
| Comparable Projects |
|
|
|
|
| Success Stories |
|
|
|
| Youga |  | 90% WI | Burkina Faso | 9-Production |
|---|
| Youga 43-101 Economic Study (USD except where noted otherwise) |
| FS | Jan 1, 2005 |
| | Youga |
| Mining Scenario | TR | Mining Costs |
| Mining Type: | OP |
| Cost Currency: | USD |
| Processing Type: | CIL |
| Capital Cost: | $34,000,000 |
| Operating Rate: | 2,700 tpd |
| Sustaining Cost: | $3,225,000 |
| Operating Days: | 365 |
| Operating Cost: | $20.91/t |
| Strip Rate: | 5.5 |
| BC Cash Cost per Unit: USD | $234/oz Au |
| Mine Life: | 6 years |
| BC Cash Cost Net By-Products: USD | $234/oz Au |
| LOM Tonnage: | 5,500,000 t |
| BC All-In Cost Net By-Prod: USD | $311/oz Au |
| Est Startup: |
|
| Spot All-In Cost Net By-Prod: USD | $311/oz Au |
| Production Potential |
| Metal 1 | Metal 2 | Metal 3 | Metal 4 |
| Metal: | Au |
|
|
|
| Grade: | 2.90 g/t |
|
|
|
| Recovery: | 95.0% |
|
|
|
| Annual Output: | 88,000 oz |
|
|
|
| LOM Output: | 482,913 oz |
|
|
|
| Base Case Price: | $400/oz |
|
|
|
| Spot Price: | $1,315/oz |
|
|
|
| Base Case NSR: | $35.72/t |
|
|
|
| Spot NSR: | $117.43/t |
|
|
|
| Base Case Valuation |
| Reported Valuation Currency: | USD |
| Pre-Tax NPV: | $14,500,000 |
| Discount Rate: | 10% |
| After-Tax NPV: |
|
| Total Base Case NSR USD: | $35.72/t |
| Pre-Tax IRR: | 25% |
| Total Spot NSR USD: | $117.43/t |
| After-Tax IRR: |
|
| Annual Pre-Tax Cash Flow Base Case and Net CF/FDSH USD: | $14,593,195 | $0.03 | Pre-Tax Payback: | 2.6 y |
| Annual Pre-Tax Cash Flow Spot and Net CF/FDSH USD: | $95,117,595 | $0.20 | After-Tax Payback: |
|
| Enterprise Value CAD : | $289,286,473 | $.68/sh | Share Price: | $0.49 |
| Note: |
| Comparative Valuations using Life of Mine Averages |
| Discount Rate: | 0% | 5% | 10% | 15% |
| Base Case Pre-Tax NPV USD: | $50,334,170 | $35,564,171 | $24,742,015 | $16,690,030 |
| Base Case Pre-Tax Net NPV/Sh USD: | $0.11 | $0.08 | $0.05 | $0.04 |
| Premium BC PT NPV over EV: | ($0.42) | ($0.46) | ($0.48) | ($0.50) |
| Spot Pre-Tax NPV USD: | $533,480,570 | $424,818,512 | $343,564,519 | $281,684,115 |
| Spot Pre-Tax Net NPV/Sh: | $1.13 | $0.90 | $0.73 | $0.60 |
| Premium Spot PT NPV over EV USD: | $0.60 | $0.37 | $0.20 | $0.07 |
| The comparative NPV calculations assume constant annual cash flow based on the life of mine average annual payable production and CapEx spent in year one. The operating cost includes the LOM sustaining capital. Due to details such as ore scheduling these NPV figures may differ from those of the 43-101 economic study. |
| After-Tax Valuations using Spot By-Product Prices |
 |
 |
| Finkolo-Tabakoroni |  | 40% TC | Mali | 7-Permitting & Feasibility |
|---|
| Firkolo - Tabakoroni 43-101 Economic Study (USD except where noted otherwise) |
| FS | Jun 10, 2010 |
| | Firkolo - Tabakoroni |
| Mining Scenario | TR | Mining Costs |
| Mining Type: | OP |
| Cost Currency: | USD |
| Processing Type: |
|
| Capital Cost: | $1,700,000 |
| Operating Rate: | 2,425 tpd |
| Sustaining Cost: | $0 |
| Operating Days: | 330 |
| Operating Cost: | $59.12/t |
| Strip Rate: | 9.5 |
| BC Cash Cost per Unit: USD | $730/oz Au |
| Mine Life: | 3 years |
| BC Cash Cost Net By-Products: USD | $730/oz Au |
| LOM Tonnage: | 2,400,000 t |
| BC All-In Cost Net By-Prod: USD | $738/oz Au |
| Est Startup: |
|
| Spot All-In Cost Net By-Prod: USD | $738/oz Au |
| Production Potential |
| Metal 1 | Metal 2 | Metal 3 | Metal 4 |
| Metal: | Au |
|
|
|
| Grade: | 3.20 g/t |
|
|
|
| Recovery: | 80.0% |
|
|
|
| Annual Output: | 64,838 oz |
|
|
|
| LOM Output: | 201,000 oz |
|
|
|
| Base Case Price: | $900/oz |
|
|
|
| Spot Price: | $1,315/oz |
|
|
|
| Base Case NSR: | $72.92/t |
|
|
|
| Spot NSR: | $106.55/t |
|
|
|
| Base Case Valuation |
| Reported Valuation Currency: | USD |
| Pre-Tax NPV: | $11,900,000 |
| Discount Rate: | 10% |
| After-Tax NPV: |
|
| Total Base Case NSR USD: | $72.92/t |
| Pre-Tax IRR: | 0% |
| Total Spot NSR USD: | $106.55/t |
| After-Tax IRR: |
|
| Annual Pre-Tax Cash Flow Base Case and Net CF/FDSH USD: | $11,043,420 | $0.01 | Pre-Tax Payback: | 2.5 y |
| Annual Pre-Tax Cash Flow Spot and Net CF/FDSH USD: | $37,954,432 | $0.04 | After-Tax Payback: |
|
| Enterprise Value CAD : | $289,286,473 | $.68/sh | Share Price: | $0.49 |
| Note: |
| Comparative Valuations using Life of Mine Averages |
| Discount Rate: | 0% | 5% | 10% | 15% |
| Base Case Pre-Tax NPV USD: | $31,430,260 | $27,022,830 | $23,421,228 | $20,447,490 |
| Base Case Pre-Tax Net NPV/Sh USD: | $0.03 | $0.03 | $0.02 | $0.02 |
| Premium BC PT NPV over EV: | ($0.50) | ($0.51) | ($0.51) | ($0.51) |
| Spot Pre-Tax NPV USD: | $112,163,296 | $96,818,411 | $84,260,959 | $73,876,967 |
| Spot Pre-Tax Net NPV/Sh: | $0.11 | $0.09 | $0.08 | $0.07 |
| Premium Spot PT NPV over EV USD: | ($0.43) | ($0.44) | ($0.45) | ($0.46) |
| The comparative NPV calculations assume constant annual cash flow based on the life of mine average annual payable production and CapEx spent in year one. The operating cost includes the LOM sustaining capital. Due to details such as ore scheduling these NPV figures may differ from those of the 43-101 economic study. |
| After-Tax Valuations using Spot By-Product Prices |
 |
 |
| Agbaou | | 85% WI | Cote D'Ivoire (Ivory Coast) | 7-Permitting & Feasibility |
|---|
| Agbou 43-101 Economic Study (USD except where noted otherwise) |
| FS | Nov 1, 2008 |
| MDM Engineering | Agbou |
| Mining Scenario | TR | Mining Costs |
| Mining Type: | OP |
| Cost Currency: | USD |
| Processing Type: | CIL |
| Capital Cost: | $113,023,000 |
| Operating Rate: | 3,300 tpd |
| Sustaining Cost: | $0 |
| Operating Days: | 365 |
| Operating Cost: | $35.40/t |
| Strip Rate: | 8.0 |
| BC Cash Cost per Unit: USD | $520/oz Au |
| Mine Life: | 6 years |
| BC Cash Cost Net By-Products: USD | $520/oz Au |
| LOM Tonnage: | 7,400,000 t |
| BC All-In Cost Net By-Prod: USD | $739/oz Au |
| Est Startup: |
|
| Spot All-In Cost Net By-Prod: USD | $739/oz Au |
| Production Potential |
| Metal 1 | Metal 2 | Metal 3 | Metal 4 |
| Metal: | Au |
|
|
|
| Grade: | 2.40 g/t |
|
|
|
| Recovery: | 92.0% |
|
|
|
| Annual Output: | 82,000 oz |
|
|
|
| LOM Output: | 516,200 oz |
|
|
|
| Base Case Price: | $850/oz |
|
|
|
| Spot Price: | $1,315/oz |
|
|
|
| Base Case NSR: | $57.87/t |
|
|
|
| Spot NSR: | $89.53/t |
|
|
|
| Base Case Valuation |
| Reported Valuation Currency: | USD |
| Pre-Tax NPV: | $48,200,000 |
| Discount Rate: | 0% |
| After-Tax NPV: |
|
| Total Base Case NSR USD: | $57.87/t |
| Pre-Tax IRR: | 9% |
| Total Spot NSR USD: | $89.53/t |
| After-Tax IRR: |
|
| Annual Pre-Tax Cash Flow Base Case and Net CF/FDSH USD: | $27,060,700 | $0.05 | Pre-Tax Payback: | 5.0 y |
| Annual Pre-Tax Cash Flow Spot and Net CF/FDSH USD: | $65,194,800 | $0.13 | After-Tax Payback: |
|
| Enterprise Value CAD : | $289,286,473 | $.68/sh | Share Price: | $0.49 |
| Note: |
| Comparative Valuations using Life of Mine Averages |
| Discount Rate: | 0% | 5% | 10% | 15% |
| Base Case Pre-Tax NPV USD: | $49,341,200 | $23,170,267 | $4,394,003 | ($9,228,043) |
| Base Case Pre-Tax Net NPV/Sh USD: | $0.10 | $0.05 | $0.01 | ($0.02) |
| Premium BC PT NPV over EV: | ($0.43) | ($0.48) | ($0.52) | ($0.55) |
| Spot Pre-Tax NPV USD: | $278,145,800 | $207,510,218 | $155,379,409 | $116,265,732 |
| Spot Pre-Tax Net NPV/Sh: | $0.56 | $0.42 | $0.31 | $0.23 |
| Premium Spot PT NPV over EV USD: | $0.03 | ($0.11) | ($0.22) | ($0.30) |
| The comparative NPV calculations assume constant annual cash flow based on the life of mine average annual payable production and CapEx spent in year one. The operating cost includes the LOM sustaining capital. Due to details such as ore scheduling these NPV figures may differ from those of the 43-101 economic study. |
| After-Tax Valuations using Spot By-Product Prices |
 |
 |
|