| Kaiser Watch March 29, 2024: Ys $2,000 finally the floor for gold? |
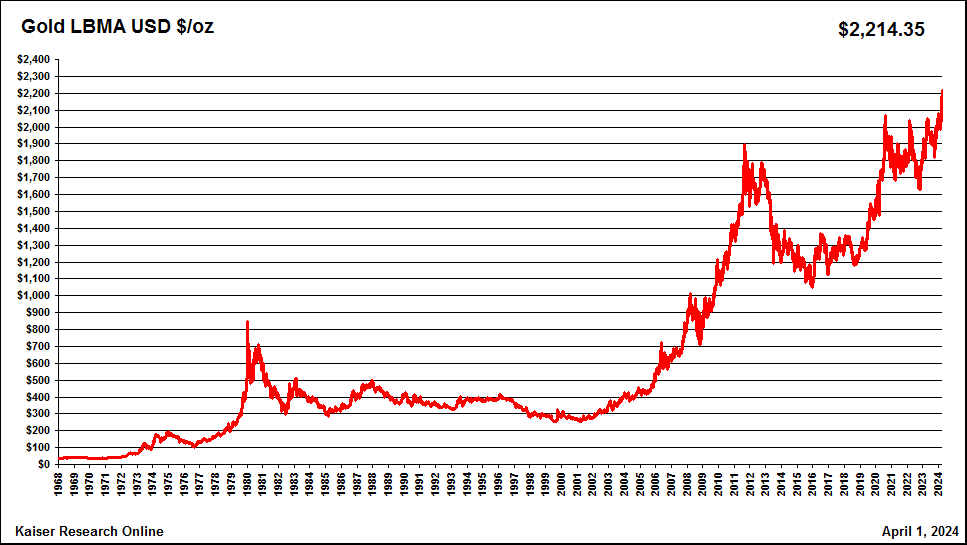
| Jim (0:00:00): How is the market responding to the recent gold uptrend that on Thursday achieved an all-time high of $2,214? |
Gold achieved an all time high of $2,214 per oz on the LBMA on March 28, 2024, registering an 11.5% gain from its 2024 low achieved on February 14, 2024. Gold's uptrend has not been tracked by silver which for the past year has traded in a narrow range of $23-$25 per oz. This disconnect is evident in the uptrend of the gold-silver price ratio which now stands at 90.2. That there should be linkage between the price of gold and silver is a construct of the hard money crowd which forgets that gold is primarily produced as a store of value in the form of coins, bullion and jewelry that largely sit in vaults doing nothing, while most of the above ground silver stock is fabricated into some useful application. Most gold production is of a primary nature, while most silver is a by-product of base metal mines and some gold mines. As a result it gets produced regardless of the silver price and gets sold at whatever the market price is. The fact that there is no obvious new usage for gold, such as we see with solar technology for silver and EV batteries for lithium, makes the recent independent uptrend a very curious phenomenon.
The usual gold price drivers invoked by the hard money advocates are not offering explanatory reasons for the demand that is driving up the price of gold. Inflation has come down from its 9.1% peak in June 2022 and has bounced between 3%-4% since June 2023, which is still above the Federal Reserve's 2.0% target though Jerome Powell has signaled three federal rate cuts totaling 0.75% in the second half of 2024 on the assumption that the negative impact of high interest rates are still working their way through the economy (for example about $2 trillion worth of commercial real estate debt is coming due by 2026, much of whose value has been compromised by pandemic triggered shift to working from home). The US treasury yield curve is slightly inverted, offering 5.5% for 1 month terms down to 4.18% for 7 year terms rising to 4.45% for a 20 year term. After a decade during which retirees and other savers got almost zero interest for their savings, as one can see from the awful yield curve on January 6, 2021, gold ownership which yields no income but does incur storage costs if a meaningful amount is owned hardly seems a good asset allocation strategy today.
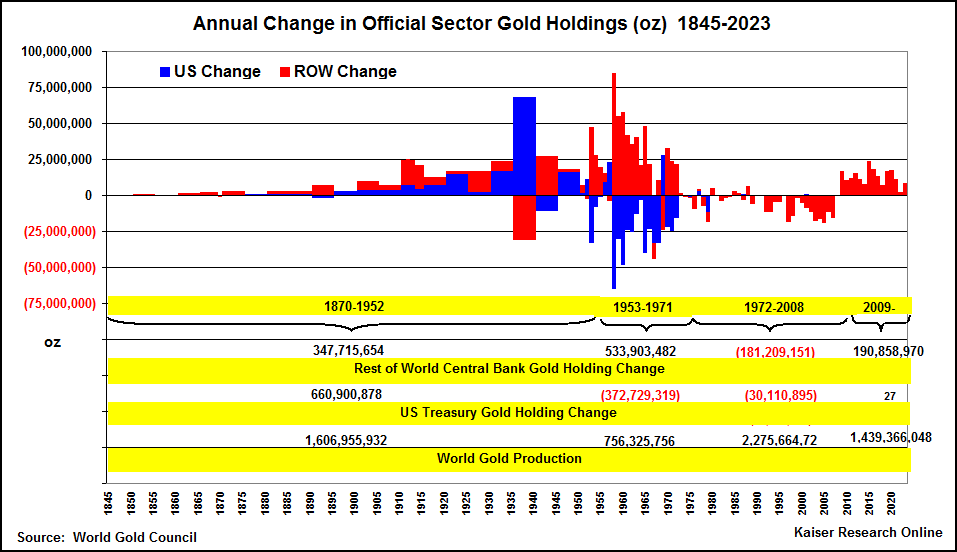
Another common suspect behind an uptrending gold price is the US dollar weakening against other currencies, but the Nominal Broad Currency Index has been tracking sideways near its multi-decade high for the past year (a downtrend in the index represents other currencies rising against the US dollar). In terms of official sector buying the reversal of a 35 year spree of net central bank liquidation which began in 2009 slowed during the past two years, though there are reasons to believe that state owned Chinese entities have been secretly buying China's gold production. In 2007 China became the world's biggest gold producer and has maintained that lead. At the end of 2000 China's official gold reserves were about 13 million ounces, growing to about 72 million ounces at the end of 2023. But since then China has produced 251 million ounces, raising the question, who bought the other 192 million ounces? During that same period The United States produced 172 million ounces but its official holdings have been unchanged, so we know US gold production was sold into the open market. However, if China has hoarded all its gold production at the state level, which would make its official reserves 264 million ounces, slightly more than the 262 million ounces held by the United States, it simply means that the private sector has not had to eat each year's new Chinese mine supply. If you believe the official holdings report from the World Gold Council central banks have accumulated only 13% of the 1.4 billion ounces produced since 2009. The upshot is that official sector buying has not been a meaningful factor in the gold market, and is unlikely to be the source of the uptrend since mid February.
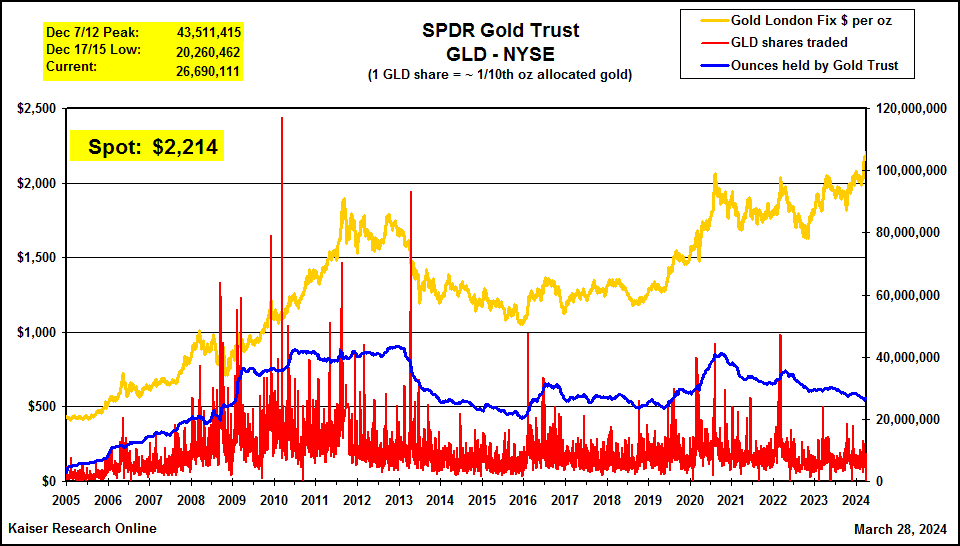
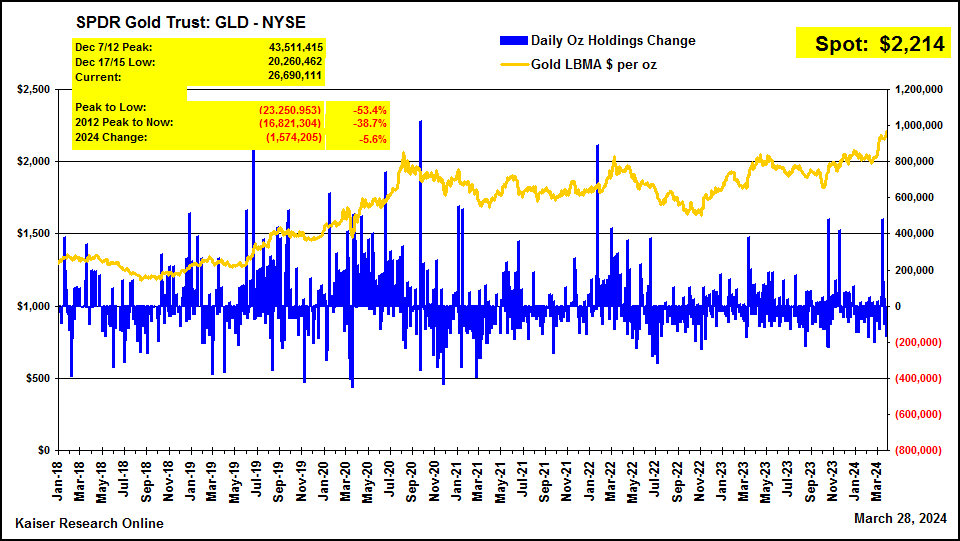
Another common suspect is the gold ETFs of which the SPDR Gold Trust (GLD-NYSE) is the biggest since its creation in 2005 with the help of the WGC to make physical gold more accessible to fund managers and individual investors. The GLD ETF has a mechanism whereby it accumulates gold when there is net investor buying that creates an arbitrage opportunity for a designated group of bankers to sell GLD paper short while buying cheaper physical gold in the bullion market. The short is covered by delivering the physical gold to the Gold Trust in exchange for GLD paper. The GLD's gold holdings peaked at 45.3 million ounces on December 7, 2012, and as the price of gold plunged lost 23.3 million ounces until its nadir on December 17, 2015. The 2020 covid pandemic generated a surge in investor demand for the GLD whose holdings climbed 12.4 million ounces from the start of 2020 to a peak of 41.1 million ounces on October 14, 2020. But apart from a short-lived burst during H1 of 2022 during the Russian invasion of Ukraine, just before the Federal Reserve began to raise interest rates, the GLD ETF has been steadily losing gold ounces. In 2024 the GLD had lost just over 2 million ounces by March 11 before it began to recover ounces. As of March 28 the GLD was still down 1.5 million ounces since the start of 2024. When you look at a chart which plots the daily changes in GLD gold holdings it is clear that investors are abandoning gold as an investment asset class, not accumulating.
The siren song that is luring investors away from gold is the resurgence of demand for BitCoin created by Wall Street securing approval for a raft of ETFs which track the price in the Bitcoin blockchain. Investors no longer need to worry that their "wallet" will disappear with a hard disk failure, the failure of a crypto-currency exchange, or the disappearance of key passwords. Since bottoming in late 2022 BTC has rebounded to make a new high at $73,750 and as of March 29 the existing BTC "stock" of 19.67 million coins had a value of about $1.4 trillion at $69,875 per coin. What is the intrinsic value of a Bitcoin? That concept makes no sense because BTC refers only to itself as a digital number with a coded limit that is priced in US dollars. Its value will be whatever somebody else is willing to pay for it and Wall Street is busy pumping Bitcoin to suckers as a legitimate asset class. In fact, it should be understood as a liability class because the ability to unload your BTC depends on energy being consumed as Bitcoin miners race to guess the numerical key that allows a transaction to take place. Bitcoin's very success will be the architect of its demise as the corresponding energy consumption goes through the roof, energy spent to facilitate the laundering of criminal proceeds and unproductive gambling activity. Bitcoin has two threats on the horizon which will kill Bitcoin mining. One is the AI Dream which will have enormous energy requirements once it gets rolling and starts delivering benefits in the material world rather than just unemployment for white collar "knowledge" workers rendered useless by AI processes. The other is the rising electricity demand from air conditioners as everybody scrambles to escape the consequences of global warming. When AC and AI electricity demand start to generate brownouts, the first line of attack will be shutting down electricity consumption by Bitcoin miners.
Above ground gold, in contrast, represents stored energy, because it takes energy to extract gold from the ground and concentrate it as a bullion bar. And it is compact, with the above ground gold stock of 6.6 billion ounces (205,280 tonnes) physically occupying a 22 metre wide cube (205,280 t divided by 19.3 specific gravity root 3). Incidentally, the above ground stock of silver, about 57.4 billion ounces or 1,785,312 tonnes, would occupy a cube with a width of about 55 metres (silver's specific gravity is 10.5). The above ground gold stock is worth about $14.6 trillion at $2,214/oz price, about ten times the value of the digital Bitcoin stock, which is the same value as the silver stock at $24.54 per ounce. The problem with silver is that most of it is fabricated into something physical serving a purpose, so you cannot make a massive investment in silver which is also stored energy. The ratio of the gold to silver price is rising because somebody is moving a lot of money into physical gold through the LBMA which these days seems to be setting the gold price rather than reflecting what is going on in the North American ETF markets.
It is currently a mystery who is buying physical gold without worrying that this buying activity is driving up the price, something central banks are loathe to do. My own suspicion is that it is the tech bro community doing the buying. The general equity market, especially that comprised of the tech giants, does not seem to have much room for upside, and insider selling has recently outpaced insider buying. The tech bro community is also notoriously full of itself and early on celebrated Bitcoin as the salvation for libertarian principles. It would not surprise me at all if the tech bros are unloading their Bitcoin into the indirect hands of the suckers Wall Street is marshaling in line to buy this new asset class that needs to increase ten times in price to enjoy the current value of the above ground gold stock. Converting an intrinsically worthless asset class into a real asset is good enough in itself as a motivation, but there may be other things going on in the heads of the tech bros.
The tech bros likely have a far deeper understanding of the vulnerability of the digital worlds they have constructed than your ordinary person. In the past six months there has been an increase of articles in mainstream media reporting warnings from various government agencies about the vulnerability of infrastructure at all levels to cyber-attack. Chinese malware is said to have been inserted everywhere as a potential prelude to an invasion of Taiwan. The rationale is that when everything jams up in the United States it will be too distracted to mobilize a response. Russian, Iranian and North Korean hackers are also doing their best to make it possible to implode the Global West from within. Authorities have dismissed the mysterious crash of the Dali freighter into the Francis Key Scott bridge spanning Baltimore's port harbor as an act of terrorism. Was this just a case of bad luck where Murphy's Law conspired to neutralize all backup and safety systems designed to prevent a complete power outage? Or was this a test run for remotely shutting down infrastructure? Whichever it was, the Baltimore incident is an example of what a deliberate cyber-attack might accomplish. That fear is not going to go away. Whoever is buying physical gold is doing so to end up with ownership of an asset class that once delivered to its purchaser is not going to evaporate when all hell breaks out in the digital world. It could still be stolen but I'm sure somebody buying gold on that scale can afford the security to prevent that from happening.
In 2020 I created a Gold Producer Index consisting of companies producing at least 100,000 ounces gold annually. It is an equally weighted index based on the closing gold ($1,523) and stock prices on December 31, 2019. The panic that swept markets in March 2020 when the world realized that covid was a life-threatening virus dragged the index down 30.7%, but by July 2020 it had bounced back with a peak gain of 56.4% as gold surged through $2,000. The big disappointment has been that since then as gold struggled to turn $2,000 into a floor rather than a ceiling the KRO 2020 Gold Producer Index has performed poorly. Partly to blame is the inflation which erupted globally that would have boosted OpEx to a greater degree than the general CPI figure.
Another reason is the growing perception that gold is an obsolete asset class that cannot compete with digital asset classes such as Bitcoin. When Nixon released gold from its $35 per oz peg to the US dollar in 1972 during an inflationary period the price shot to a high of $850 before stabilizing at around $400 in 1980 where it traded plus or minus $50 for the next two decades while the hard money crowd brayed about $2,000 gold. More than four decades later we finally have $2,000 gold but it is a pyrrhic victory. $400 gold CPI inflation adjusted from 1980 to the present is $1,554, which means that $2,214 represents a 43% real gain for the price of gold. But during those 43 years the mining industry produced 3.4 billion ounces, more than double the 3.2 billion ounces estimated to be the above ground stock in 1980. Not only has the mining industry harvested all the low hanging fruit that gold's tenfold increase during the seventies made available, but the CPI inflation figures reflect the productivity gains achieved by the digital revolution as well as the effect of globalization on the cost of consumer goods and services. Not only does the mining industry face a future of high hanging fruit in the form of what is left in the ground to find and mine (ie lower grade, poor metallurgy, access restrictions), but the CapEx and Opex for doing so is a lot higher than you get applying CPI to those costs in 1980. The 43% real price gain represented by $2,214 gold is thus an illusion, and the market knows it. What matters for the market is the idea that gold could reprice upwards to the $4,000 level without a major resurgence of inflation that keeps projects marginal that are currently marginal at $2,000.
Global gold production peaked in 2017 and is doomed to decline if the price of gold merely tracks inflation unless there is a discovery miracle that reveals new gold endowments that work at current prices. So you would expect the prices of gold producers to do poorly and not really follow any uptrend in the price of gold, especially if the $2,000 ceiling keeps reasserting itself in the short term as it did this year with gold bottoming at $1,985 in mid February. Remarkably, although gold is up only 12% from this February low, gold producers that have not suffered bad news like mine accidents have started to track gold's uptrend. You can see that in the Daily Index Performance chart which displays what percentage the index was up or down each day. The top tier producers Barrick and Newmont are up 18% and 20% respectively, followed by Agnico-Eagle up 32%. The mid-tier producers are generally up in the 35%-65% range from their 2024 lows. The index as a whole, which is down to 41 members from 53 due to buyouts and a couple failures, is up 22.6% from its February 13 low, and up 44.2% from its inception at the start of 2020. But for this uptrend to be sustained we need to see that $2,000 is indeed the floor from which bigger gains, perhaps into the $3,000-$4,000 range, can be launched. For the first to be convincing we need to survive Q2 of 2024, but for a gold bull cycle to emerge we need to see further gold price gains. |

KRO 2020 Gold Producer Index (100,000+ oz annual production) |
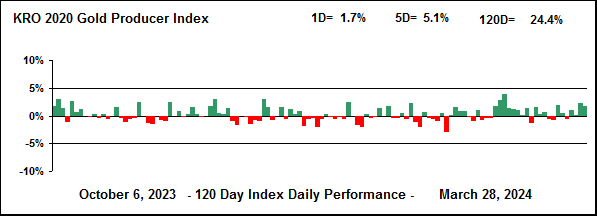
Daily Up-Down Chart past 120 days for KRO 2020 Gold Producer Index |
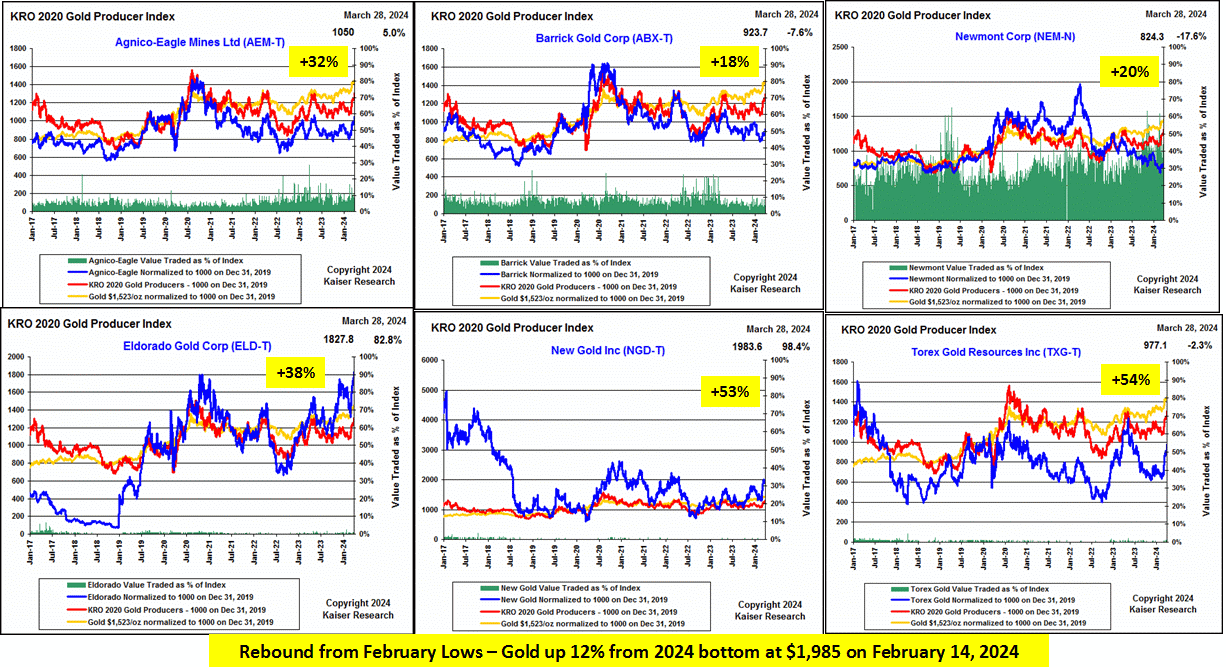
Gains from 2024 lows for a selection of top and mid tier producers |
Long Term Chart for LMBA Gold closing price |
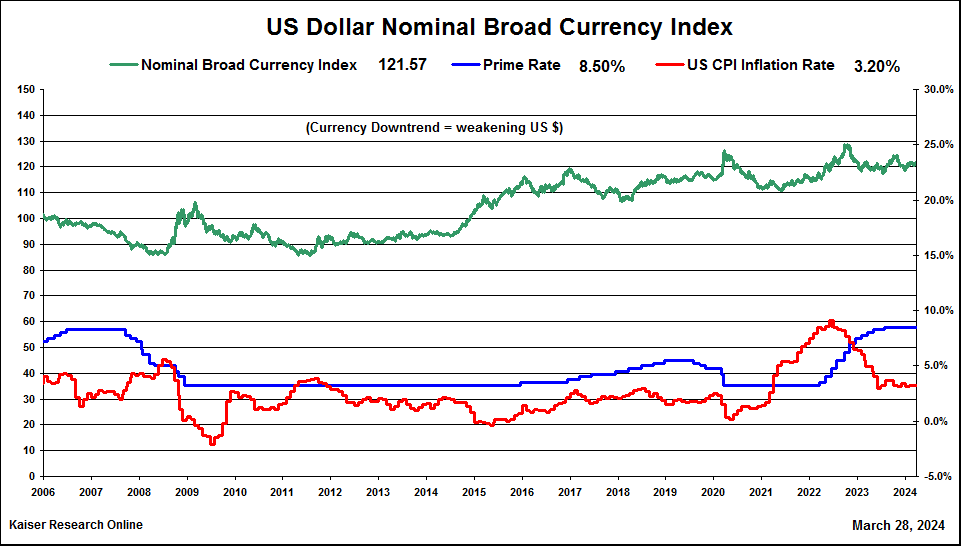
Chart showing stable patterns for USD Index, Inflation and Interest Rates |
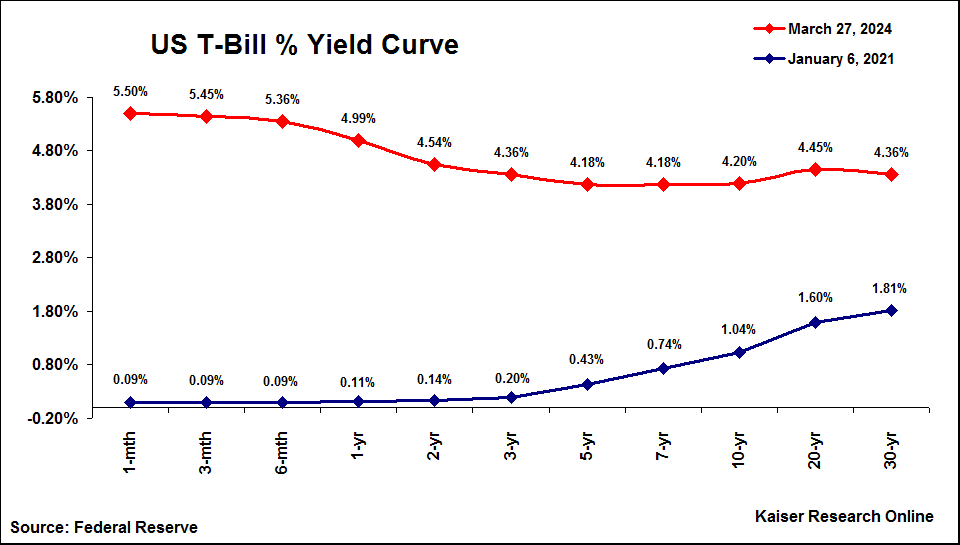
US Treasury Bill Yield Curve - Jan 6, 2021 vs Mar 27, 2024 |

Chart showing inflation adjusted gold price from 1980 benchmarks $400 and $850 |

BitCoin Chart: $1.4 trillion BTC value vs $14.6 trillion Gold Stock Value |
GLD ETF Chart with daily gold holdings and NYSE volume compared to gold price |
GLD ETF Chart showing daily changes in gold holdings 2018-2024 |

GLD ETF Chart showing daily changes in gold holdings 2005-2024 |

Gold to Silver Ratio Chart - silver is not tracking gold's uptrend |

Cumulative Chinese gold production 2020-2023 and Official Reserve growth |
Long term chart of annual changes in US and ROW official gold holdings |

Annual global gold mine supply 1970-2023 |

Growth of above ground gold stock 1845-2023 |
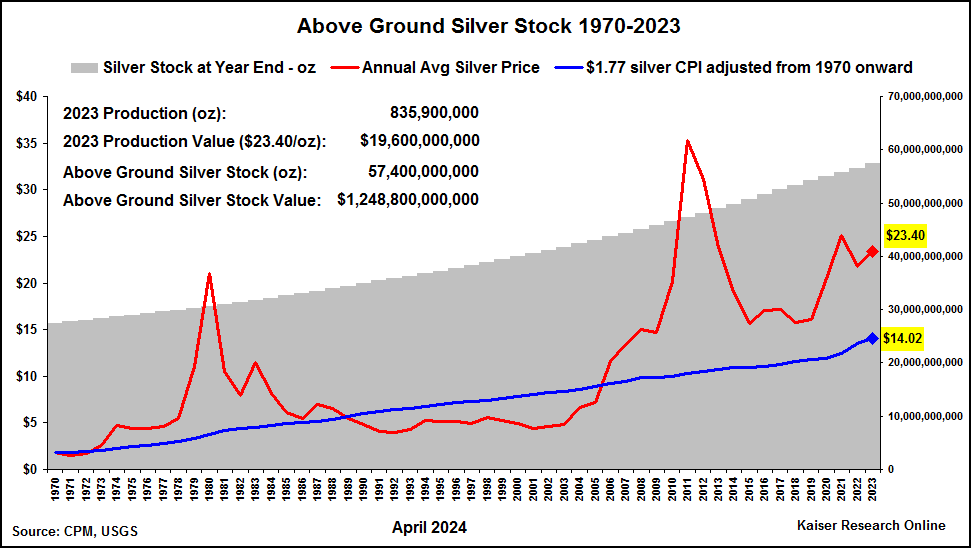
Growth of above ground silver stock 1970-2023 |
| Jim (0:10:50): Which juniors in your KRO Favorites would you pick to bet on gold? |
The gold juniors have so far not responded to the six week uptrend in the price of gold because it is too soon to tell if $2,000 is indeed the new floor for gold rather than its ceiling. Gold producers have responded but their ability to post further gains will require gold to establish $2,500 as a new trading level where the real price gain is 61%, not really a meaningful monetary difference, but it is the optics that count. I have two juniors in my 2024 collection which represent opposite extremes for how to play the non-producing juniors with exposure to gold.
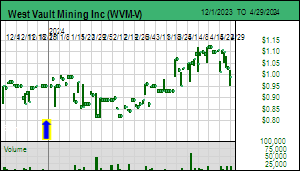
The first is West Vault Mining Inc which owns the Hasbrouck project in Nevada near Tonopah. Hasbrouck consists of two deposits that will be open-pit mined and heap leached at 17,000 tpd over an 8 year mine life during which it would produce 561,000 ounces. This project is shovel ready with all development permits in place, and the PFS was updated in January 2023 so the CapEx and OpEx numbers are reasonably reliable. At the base case price of $1,790 per oz gold the project has an after-tax IRR of 48% and net present value of USD $135.3 million at 10% discount rate and $192.6 million at 5%. Based on 59.5 million shares fully diluted and an exchange rate of 0.74 USD for 1 CAD this translates into an NPV per share range of CAD $3.09 to $4.37. The stock has been stuck in the $0.90-$1.00 range but managed to creep up to $1.03 on Thursday. The biggest shareholder is Sun Valley Gold LLC whose head Peter Palmedo has made a strategic decision to forego any further exploration activity or project diversification and just maintain West Vault as a target for a future buyout. This allows West Vault to serve as a leveraged proxy for the price of gold.
For example, at the current gold price of $2,214 the DCF model using the PFS costs generates a 79.5% after-tax IRR and a NPV per share range of CAD $5.52-$7.41. If you dare to dream of $4,000 gold without serious cost inflation, those numbers blossom to $15.75-$20.22 for 10% and 5% discount rates. The market is ignoring West Vault because it sees annual production potential of only 70,000 ounces gold, and is concerned that no producer will want to acquire and develop Hasbrouck. Given the recent mood about the future of gold and the gold mining sector compared to just gambling on a Bitcoin ETF, this aversion is understandable. But this is what gives West Vault Mining Good Speculative Value. The key development needed to turn West Vault into a $5-$10 buyout is a secular bull market for gold that fosters expectations for a higher real price for gold, and the decision by a producer to consolidate the region surrounding Tonopah and turn West Vault into the initial mine. West Vault is an example of an ounce-in-the-ground story whose feasibility has already been demonstrated and which is waiting for the right market conditions to attract a buyout in the $5-$10 range.
The other extreme is Solitario Resources Corp which is a gold exploration junior waiting for the USFS to approve a drill program for the Golden Crest project in the western part of the Black Hills area of South Dakota. The eastern part is home to the famous Homestake Mine which produced 65 million high grade ounces from basement hosted iron formation rocks, plus another 30 million ounces, some of them hosted in the much younger Deadwood formation sediments. For reasons I have described in prior KW episodes the western half of the Black Hills area received very limited exploration during the past century while the mining action was in the eastern half. One reason is that the cover rock is younger than the Deadwood Formation which hosts the Wharf gold system being mined by Coeur. Another is that the gold Solitario has found at surface is so fine grained it would not have shown up in the pans of early prospectors. So the western half of the Black Hills covered by Solitario's Golden Crest claims was stigmatized as unprospective. This is evident in a LIDAR survey over the entire Black Hills which reveals 150,000 prospect pits on the eastern half, but only 1,500 on the western half.
Solitario is an extraordinary discovery exploration play because since generating Golden Crest in 2020 the company has conducted extensive soil and rock sampling on the property which has yielded multiple areas with high grade gold values in the rocks at surface. The latest news has been on the Ponderosa block to the east of Spearfish Canyon near Hanna where the Geyser and Sleeping Beauty targets have now been recognized as a northeast trending area of interest 3 km by 2 km. The Ponderosa Plan of Operations was applied for in 2023 so these targets will not be permitted for drilling until 2025. For now Solitario is waiting for the final response by the USFS to the comment period objections made about the Golden Crest Plan of Operations. Approval is possible in the second half of April, though in a country haunted by permitting obstacles and anti-mining lifestyle NGOs no discovery is possible until a drill permit is granted.
Solitario has USD $8.3 million working capital and only 87 million shares fully diluted, which means that the implied value of Golden Crest is CAD $71 million at $0.81. If you assume that is fair speculative value for a project still at the target testing stage, the implied outcome is potentially worth CAD $4 billion if there is no further dilution bringing the project to the production stage. In per share terms that translates into a CAD $46.29 price target. Normally it would take 5-10 years to take a project from the discovery delineation stage into production, but resource junior market dynamics include something called an S-curve, also known as the Lassonde curve, which reflects the fact that during the excitement of a new discovery whose limits have not yet been delineated, the market can end up assigning a valuation during discovery delineation that matches what the project eventually ends up being worth when ready to go into production. Add in the fact that Solitario also trades on the NYSE with the symbol XPL, meaning it is eligible for Robinhooders to trade, this stock has the potential for mind-boggling gains. To be ultimately worth $4 billion Solitario will need to demonstrate 10 million plus medium grade ounces which would be quite an accomplishment. What makes Solitario so interesting is that thanks to circumstances created by mother nature Golden Crest could be sitting on a mirror image endowment of what has already been found in the eastern half of the Black Hills. This is what could drive crazy S-curve dynamics, even if the price of gold slumps back below $2,000. For West Vault to turn into a ten-bagger the price of gold needs to keep trending above $2,000; for Solitario to become a ten-bagger it needs to delivery a discovery with grade and size that works at whatever gold price we have. |
Solitario Resources Corp (SLR-T)


Favorite
Fair Spec Value |
 |
 |
| Golden Crest |
United States - South Dakota |
2-Target Drilling |
Au |
West Vault Mining Inc (WVM-V)
Favorite
Good Spec Value |
 |
 |
| Hasbrouck |
United States - Nevada |
7-Permitting & Feasibility |
Au Ag |

DCF Model showing AT NPV of West Vault's Hasbrouck project at various gold prices |

DCF Model showing AT NPV per share for West Vault's Hasbrouck project at various gold prices |

Graphic showing location of Solitario's Ponderosa Plan of Operations |

IPV Chart showing implied target outcome if current valuation for Golden Crest is fair |
| Jim (0:20:06): What do the latest Canalaska Uranium results for the Pike discovery mean? |
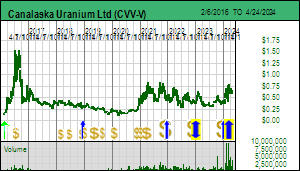
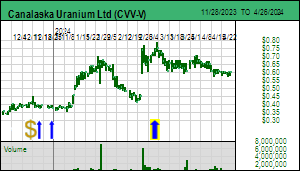
Canalaska Uranium Ltd released radiometric assays on March 27, 2024 for two additional holes at its Pike discovery on the West McArthur property on the eastern flank of Saskatchewan's Athabasca Basin. The market had a lukewarm reaction to the news because the followup holes to WMA082-04 released on February 28 only stepped 20 metres across the graphitic pelite structure. The importance of hole #4 was that it intersected high grade mineralization at the unconformity between the overlying sandstone and the basement granite within the northeast oriented structural zone which is filled with graphitic pelite. The initial news did not include a section with the #4 hole but the latest news does and it is the combination of the plan and section presentation of the drilling so far which is the real importance of this update. This tells us that Canalaska is starting to understand the geometry of the Pike zone,
Hole #5 was a 20 m stepout to the north across the strike of the graphitic pelite filled structural corridor which yielded 4.5 m of 1.4% eU3O8 which included 2.0 m of 2.78%. As the section shows this hole intersected uranium only in sandstone before hitting basement, which is due to a local fault that downdropped the sandstone northwest of the main structural corridor. I suspect the mood was rather glum when they finished hole #5 - where is that graphitic pelite corridor? These are the sort of local geometry complexities encountered when delineating unconformity style deposits.
With hole #6 they tried only a 10 m stepout and this time did intersect high grade uranium of 11.5 m at 10.84% eU3O8 including 9.5 m as 12.99%. So they know the mineralized portion of the corridor is at least 20 m wide. What we do not yet have are stepouts along the strike of the structural corridor. We also do not have new information about how the uranium mineralization behaves deeper within the pelite zone, though the earlier #2 hole intersected the graphitic pelite at about 40 m beneath the unconformity and nipped 6.3 m of 1.03% U3O8. This hole intersected the pelite zone about 30 metres along strike to the northeast.
I have created an outcome visualization for a McArthur River clone discovery which imagines what 1,062,000 tonnes of 16.46% U3O8 might be worth at the scale McArthur was developed (200 tpd). Yes these high grade unconformity deposits are small; Pod 2 at 17.3% has a rock value of $33,563 per tonne at $88/lb U3O8. At $88/lb U3O8 price that outcome indicates an after-tax IRR of 52.1% and NPV of CAD $7.9 billion at an 8% discount rate. Based on Canalaska's 212 million fully diluted and 83.3% net interest that converts into an NPV per share price target of $30.84 per share. For that sort of future outcome the $0.61 stock price represents good speculative value, which means that S-curve action has not yet kicked in with the Pike zone.
To get a sense of how close we are to a tipping point for S-curve action I tracked down a paper Mining the high grade McArthur River uranium deposit written by B.W. Jamieson for Cameco. This paper has reserve estimates for Pods 1 and 2, of which Pod 2 is the larger at 577,000 tonnes of 17.3% U3O8. The paper describes Pod 2 as having a strike length of 100 m, height varying 30-90 m and width typically 20 m. The specific gravity of U3O8 is 8.3 but the ore will be lower. If we assume dimensions of 100 m x 20 m x 60 m = 120,000 cu m, and divide the 577,000 t Pod 2 by that number we get a specific gravity of 4.8. Pod 2 was delineated from underground (500-600 m depth). The paper includes a geology diagram showing the complexity of Pod 2.
To create some tonnage context for the Pike there is about 25 m along strike on both sides of this line of 3 holes across the corridor before earlier holes potentially limit the zone. This allows us to assume a scenario of 50 m of potential strike by 20 m width and say 50 m depth as a delineation target. Using 4.8 as a specific gravity that translates into a "pod" of 240,000 tonnes. If you use the McArthur grade of 16.46% U3O8 that translates into about 87 million lbs of U3O8, less than a quarter of McArthur's 380 million lb endowment. So we are not yet at McArthur tonnage scale, and, of course, the average grade remains to be determined.
It is important to keep in mind the intensity of the mineralization and alteration halo of the Pike Zone which is what allows us to dream about a McArthur clone outcome. While a drill is testing other targets at West McArthur until late April, Canalaska has stopped drilling the Pike zone while it awaits geochemical assays to confirm the eU3O8 readings. Canalaska plans to resume delineation drilling of the Pike zone in June. I've added green circles to the plan and section to illustrate the delineation focus for this summer. I've also added blue ovals to the plan view to show what Cory Belyk means when he talks about a "string of pearls" occurring at the unconformity within the graphitic pelite structural corridor. Maybe the roving drill still at West McArthur will hit another pearl, which would be an S-curve tipping point because it would eliminate concerns that the Pike zone is just "this little thing" at 815 m depth. |
Canalaska Uranium Ltd (CVV-V)
Good Spec Value |
 |
 |
| West McArthur |
Canada - Saskatchewan |
3-Discovery Delineation |
U |

Canalaska West McArthur Section and Plan showing "string of pearls" potential |

Graphic showing complexity of McArthur River Pod 2 (577,000 t @ 17.3% U3O8) |

IPV Chart for McArthur River Clone Outcome Visualization |
| Disclosure: JK owns none of the stocks mentioned; Canalaska and West Vault are Good Spec Value rated Favorites; Solitario is a Fair Spec Value rated Favorite |