Home / Research Tools
Research Tools
| | Corporate Profile: Virginia Mines Inc
Publisher: Kaiser Research Online
Author: Copyright 2013 John A. Kaiser
|
| |
Virginia Mines Inc (VGQ-T)
| Virginia Mines is the successor to Andre Gaumond's Virginia Gold Mines, which was acquired by Goldcorp in April 2006 for $710 million as Goldcorp sought to acquire control of the Eleanore gold project in the James Bay region of Quebec. Virginia maintains a large portfolio of exploration projects in Eastern Canada, has a very strong treasury, and maintains a 2% royalty on Eleanore, where Goldcorp's 43-101 compliant resource estimate as of December 31, 2008 was 7 million tonnes at 10.05 g/t Au in the measured and indicated category and 7.39 million tonnes at 12.75 g/t Au in the inferred category, for a total of 5.31 million gold ounces. Advance royalty payments of $100,000 monthly begin in April 2009. In September 2010 the company also announced a strategic exploration alliance with Wemindji Exploration Inc, a mining exploration company controlled by Cree interest from the Wemindji community, to carry out geological reconnaissance, sampling and exploration work on a territory covering a surface area of more than 5,000 square kilometres, in the middle north of Quebec. An additional exploration alliance for nickel and copper mineralization was announced with KGHM International Ltd. (formerly Quadra FNX Mining Ltd.), in June 2012 and in July 2012 an additional exploration alliance was formed with Altius Minerals o explore for base metals and precious metals on the North Shore area of Quebec and in southern Labrador. In November 2014 the company indicated it had agreed to merge with Osisko Gold Royalties, with VGQ shareholders receiving 0.92 Osisko shares per VGQ share, roughly $14.19 per Virginia share at the time the offer was made. |
Key to Understanding IPV Charts and Spec Value Hunter Tables
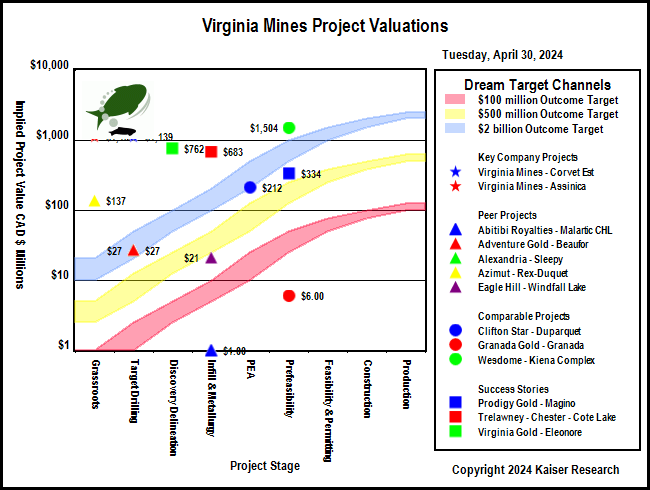
| An IPV Chart is a graphical presentation of a Spec Value Hunter table that has been constructed according to the Rational Speculation Model developed by John Kaiser. The IPV Chart allows speculators to identify which projects offer poor, fair or good speculative value in both absolute and relative terms. The speculative value depends on the project stage, the project's implied value as calculated by the company's fully diluted capitalization, stock price and net project interest, and the dream target deemed appropriate for the project. A dream target is what a project would be worth in discounted cash flow terms once in production. |
| Green background indicates the dream target judged appropriate for this play by John Kaiser - otherwise unranked. |
Poor Speculative Value -   |
Fair Speculative Value -  |
Good Speculative Value -   |
| Note: narrow arrows indicate IPV is outside the fair value channel but within 25% of the fair value limits |
| Click on the company name to view the company profile, the project name to view project details. |
| Click on the project icon if its background is shaded to get the IPV Chart for that company. |
|
| |
| | You can return to the Top of this page
|
|