Home / Research Tools
Research Tools
| | State of the Junior Resource Sector
Publisher: Kaiser Research Online
Author: Copyright 2019 John A. Kaiser
|
| |
| The State of the Junior Resource Sector |
| The 2008 financial crisis caused the resource juniors to crash as the market effectively went no bid. In Q2 of 2009 a remarkable rebound got underway which tracked gold's ascent and surprise demand for base metals as China undertook a $600 billion infrastructure spending boom to keep its economy from collapsing. By 2011 the United States and Europe had come under the sway of the austerity scolds and the opportunity for a robust fiscal response disappeared, leaving in place monetary policy as the primary driver for economic growth. Gold peaked at $1,900 in August 2011 and by 2014 the mining industry's supply mobilization response had collided with feeble global economic growth. The resource juniors shifted into a bear market in 2011 from which they only briefly emerged in 2016 and did so selectively. The start of 2000 marketed the tenth year of a bear market despite gold rising since May 2019. The Covid-19 pandemic temporarily dashed hopes for an emerging bull cycle among the juniors in March 2020, but in response to the monetary and fiscal measures for the economic downturn created by virus suppression strategies bungled in the United States, gold has sustained its uptrend, breaking $2,000 in early August 2020. Since June 2020 the junior resource sector has witnessed a dramatic awaking that is partly tracking the gold uptrend, but also anticipating a future metals price boom after the pandemic has been subdued and nations embark on massive infrastructure renewal spending to overcome the End Times funk created by Covid-19. Interestingly, this awakening is also being driven by discovery exploration, an activity that puts the value creation destiny in the hands of the junior rather than distant forces. This State of the Junior Resource Sector section is designed to allow daily monitoring of new bull cycle which may have years to run and could eclipse all prior resource junior bull markets. |

|
|
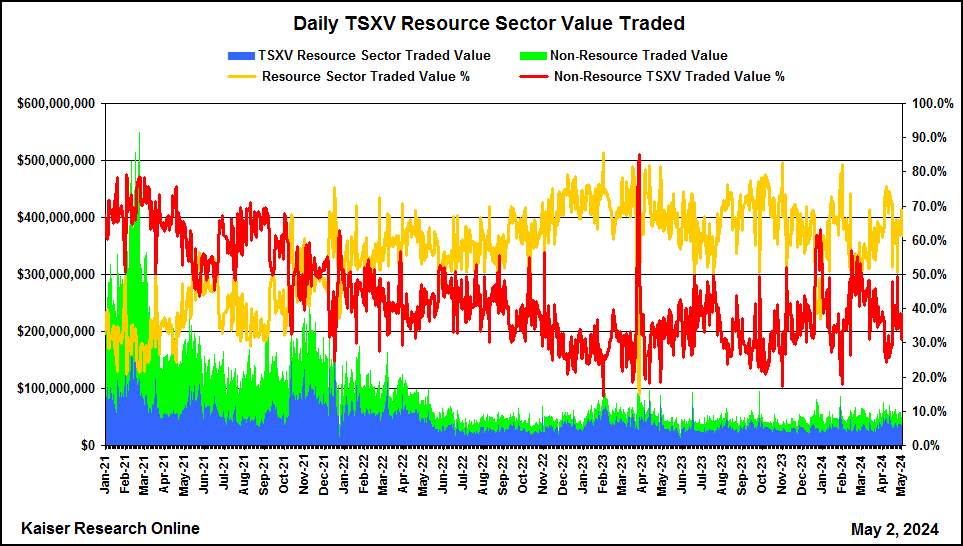
The charts above and below both present daily TSXV traded value broken down into resource (blue bars) and non-resource (green bars) listings. The above chart features the average daily traded share price for non-resource (red) and resource (yellow) listings presented as a 5 day moving average to smooth out the noise. The chart below features the relative percentage of daily traded value by non-resource (red) and resource (yellow) TSXV listings also presented as a 5 day MA. Resource listings dominated TSXV activity during the 1990s and 2000s but since the Post-2008 Crash bull cycle of 2009-2011 market activity overwhelmingly shifted to non-resource listings, driven by new conceptual bubbles such as cannabis and crypto-blockchain.
|

|
|
The charts above allow you to see current value traded activity in the context of the past decade, but the short term chart below starting January 1, 2020 allows you to see the day by day fluctuations. We do not focus on volume traded because over time there have been changes of what is viewed as an acceptable number of shares issued; money changing hands is what counts, not the number of shares. To see which resource companies dominated the last trading day's market value, visit TSXV Resource Junior Traded Value Leaders for a company list sorted by traded value.
|
|
|
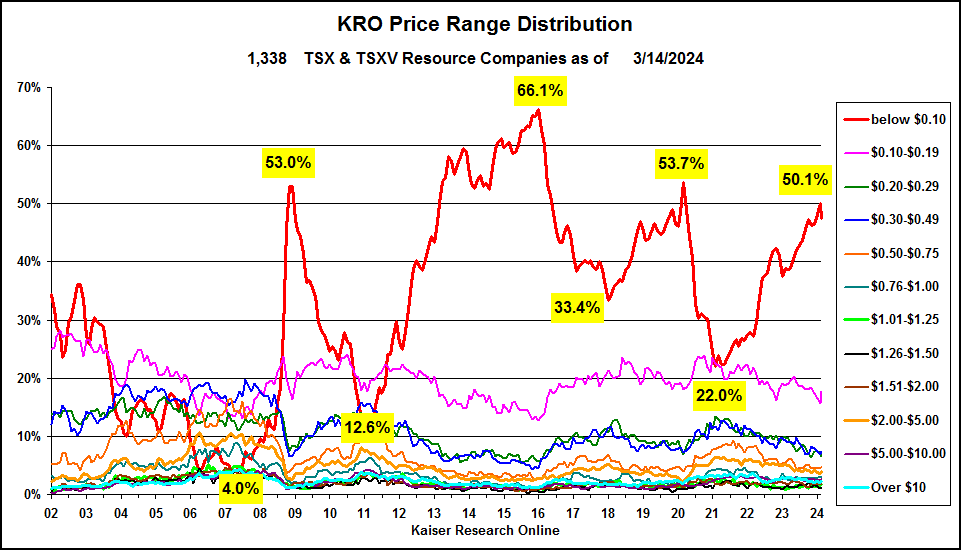
The chart below is a monthly series which tracks what % of TSXV resource listings reside in each of the price ranges which are also searchable parameters in the KRO Search Engine. They indicator to monitor is the red line which shows the % trading below $0.10. During the 2008 Crash the % trading below a dime soared to 53% of all resource listings, but underwent a remarkable rebound to only 12.6% in February 2011 just before Fukushima marked the end of the resource junior bull cycle. The worst period was in January 2016 at 66.1% just before the juniors underwent a strong recovery that tracked a gold uptrend until it failed. Another high occurred in March 2020 during the Covid-19 general market meltdown, but as of early August 2020 the percentage of TSXV resource listings trading below a dime at 32.7% is the best since early 2012.
|
|
|
The TSXV Resource Sector Fianncing chart below depicts total monthly TSXV trading value for resource (blue line) and non-resource (yellow line) listings, and monthly financing activity for resource listings only presented as red bar for private placements (subject to a 4 month hold), blue for IPOs, and green for short offering memoradum financings (immediately free trading). This chart gets updated in the second week of each month after the TSXV publishes its monthly bulletin.
|

|
|
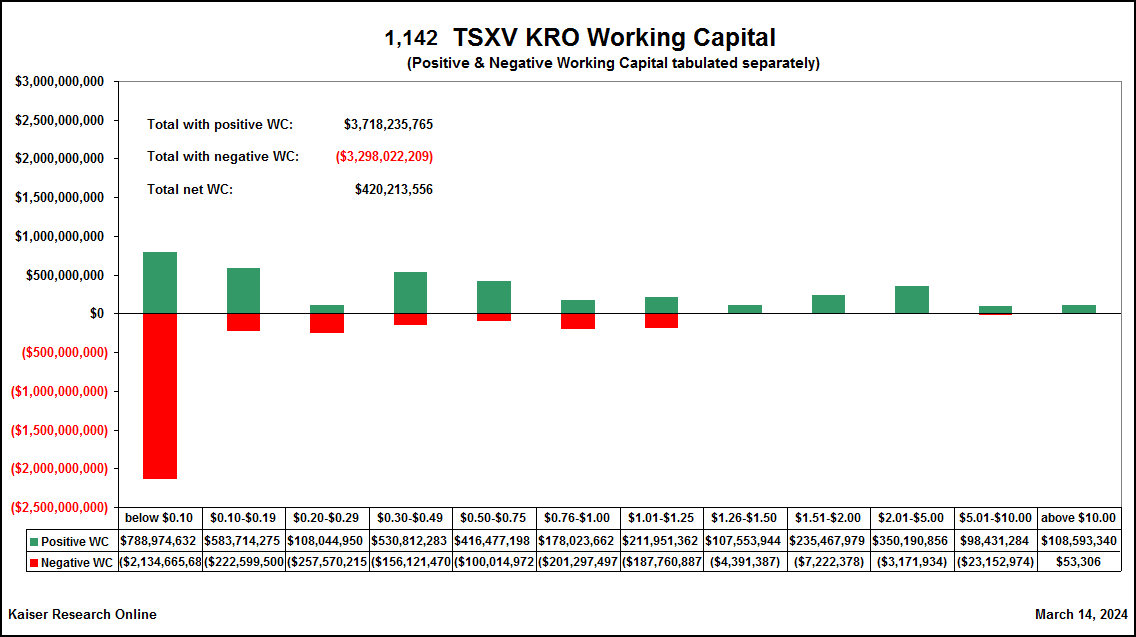
The charts below depict the financial health of the TSXV resource listings. KRO collects financial data from the quarterly financial filings which shows up in the KRO company profile for each company. We have created a series of working capital ranges which allows us to tabulate the number of TSXV resource listings in each range. The red group is for those that have negative working capital. The yellow group are those with positive working capital up to $500,000, not enough to accomplish much through exploration activity, but these juniors will have an easier time attracting new financing because the new money is not paying off old debts. The best group is the green group with $500,000 to $50 million in working capital. Only a handful of listings make it into the $50 million plus blue group because such companies usually migrate to the TSX.
|

|
|
The chart below shows where the positive and negative working capital balances sit in terms of the TSXV listing's price range. As of early August 2020 there was $404 million in positive working capital in companies trading below a dime, but beware the listings below a dime with negative working capital because they owe $1.4 billion that will probably never be paid back and will have to be converted into paper through debt settlements.
|
|
|
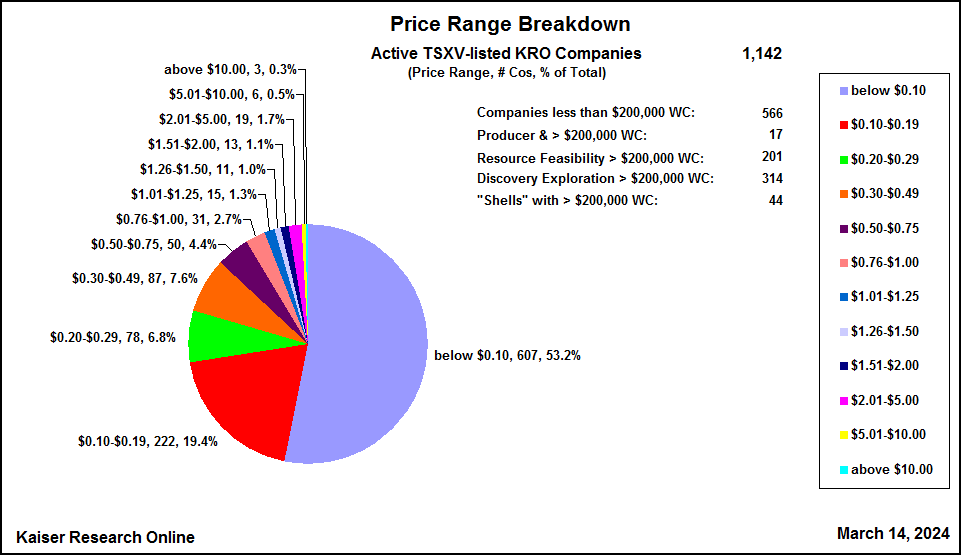
The chart below shows how many TSXV resource listings are in each of the price ranges. The majority are still trading below $0.20. Although there was a big jump during Q2 of 2020 out of the lowest price range into the $0.10-$0.19 range, that was accomplished through relatively low value traded as bottom-fishers who realized that a new resource junior bull cycle was awakening cleaned up the market in the better juniors.
|
|
|
The final chart below shows how the current market capitalization of the TSXV resource listings is distributed among the different price ranges. This chart should be looked at in the context of the above chart which shows how many listings are in each price range. During the 2016-2018 when the resource juniors mounted several attempts at launching a bull cycle, financing and trading activity was concentrated in a small percentage of listings. This awakening resource junior bull market is very broadly based and offers numerous opportunities erupting with different timelines.
|

|
|
| |
| | You can return to the Top of this page
|
|