Home / Companies / KRO Focus
KRO Focus
| Outcome Visualization Project as of Apr 19, 2024: James Bay Open Pit |
| Project: | James Bay | Location: | Canada | Stage: | 6-Prefeasibility |
| Net Interest: | 100% WI | Uncapped NSR: | 2.0% | Target Metals: | Niobium |
| OV Project ID: | 1000028 | OVP Posted: | 10/20/2020 | OVP Retired: |
|
| Current OV ID: | 1000078 | Current OV Confirmed: | 10/20/2020 | Visualizer: | JK |
Issued
79,068,523 |
Price
$0.060 |
Working Capital
$3,577,751 |
Key People: Jean-Sebastian David (CEO), Serge Savard (Chair), Anthony Glavac (CFO), |
Diluted
92,039,477 |
Insiders
19.1% |
As of
9/30/2023 |
 |  |
| Visualized Outcome: James Bay Niobium PEA 6,600 tpd OP Scenario |
| The James Bay niobium carbonatite deposit located 40 km south of the Moose Cree First Nations town of Moosonee in the James Bay Lowlands of northern Ontario was discovered in 1967. Bechtel completed a feasibility study in 1969 and updated it in 1979 but the project was never developed because of the remote location and the fact that CBMM had brought on stream the extraordinary Araxa deposit (5 times the resource and 5 times the grade), and the better located Niobec deposit in Quebec was developed. The deposit is unusual in that although it is similar in grade to the Niobec deposit, its coarser grained pyrochlore mineralization supports a recovery in the 70%-80% range compared to 50%-60% for Niobec and Araxa. The deposit was forgotten over the decades until NioBay Metals, which was already involved with the Crevier tantalum deposit in Quebec, purchased 100% of the deposit in 2016. Plans to do a PEA economic study were derailed when the chief who controlled the Moose Cree tribal council in Moosonee and who was in principle opposed to mining refused to engage in the consultations required by the Ontario mining ministry as a pre-condition for granting drill permits. This problem was not resolved until mid 2019 when a new group replaced the chief and her allies on the tribal council and secured a "protection agreement" allowing NioBay to proceed with a 7 hole drill program completed early 2020. The "social license" risk remains the dominant concern for this project advancing through feasibility and eventually being developed as the world's fourth major niobium mine. On Oct 13, 2020 NioBay published a PEA for a 6,600 tpd processing facility with 3 mining scenarios: open pit only, underground and open pit, and underground only. NioBay included an open-pit only scenario which has a 30 year mine life after feedback from the MCFN that its community might prefer that option, in particular because there may be an opportunity for the MCFN to own and operate the 64 truck fleet needed for open-pit mining. This OV presents the Open Pit only scenario. |
| Source Note: The James Bay OV is based on the open pit only scenario in the 43-101 compliant PEA published by NioBay Metals Inc on Oct 13, 20120. Costs were presented in CAD but have here been converted to USD using the 1.3 CAD:USD exchange rate used by the PEA to convert the USD ferro-niobium price to CAD. The conversion of the USD NPV into CAD to allow a per share calculation is done at the current exchange rate. |
| Visualized Outcome Summary: James Bay Niobium PEA 6,600 tpd OP Scenario |
| Deposit Scenario: 70,800,000 t @ 4,400.00 g/t Niobium |
| Mining Scenario: Open Pit 6,600 tpd 29.4 yrs, CapEx $393.0 million, SustCapEx $220.0 million, OpEx $37.30/t (USD) |
| LOM Payable: 374.0 million lb FeNb niobium |
| Economic Outcome (USD): Revenue Model at OV designated Metal Prices |
| Annual Average | Life of Mine (LOM) | LOM Stats |
| Recoverable Revenue: | $260,033,752 | $7,642,336,924 | $108/t ore Recoverable Value: |
| Smelter/Transport Costs: | $0 | $0 | 0.0% of Recoverable Revenue |
| Gross Payable Revenue: | $260,033,752 | $7,642,336,924 | 100.0% of Recoverable Revenue |
| Royalties: | ($5,200,675) | ($152,846,738) | 2.0% of Gross Payable Revenue |
| Net Payable Revenue: | $254,833,077 | $7,489,490,185 | 98.0% of Recoverable Revenue |
| Mining Cost: | ($23,001,132) | ($675,998,400) | 24% of OpEx - $9.55/t ore |
| Processing Cost: | ($48,324,540) | ($1,420,248,000) | 50% of OpEx - $20.06/t ore |
| Other Cost: | ($18,525,210) | ($544,452,000) | 19% of OpEx - $7.69/t ore |
| Sustaining Cost: | ($7,337,500) | ($220,125,000) | 8% of OpEx - $3.11/t ore |
| Total Operating Cost: | ($97,188,382) | ($2,860,823,400) | 38% of Net Payable Revenue - OpEx - $40.41/t ore |
| Pre-Tax Cash Flow: | $157,644,695 | $4,628,666,785 | 62% of Net Payable Revenue - $65.38/t ore |
| Taxes: | ($43,285,333) | ($1,270,803,536) | 27% of Pre-Tax Cash Flow - $17.95/t ore
|
| After-Tax Cash Flow: | $114,359,362 | $3,357,863,250 | 45% of Net Payable Revenue - $47.43/t ore |
| Note: Concentrate transport costs, smelter treatment costs and retention are subtracted from recoverable revenue to get gross payable revenue to which the uncapped royalty rate for the project is applied. The annual average of LOM sustaining cost is expensed as an annual operating cost. Annual average figures reflect full production years. |
| Economic Outcome (USD): Royalty Model for 1% NSR at OV designated Metal Prices |
| Mine Life: | 30 years | Startup | NPV 5% | NPV 10% | NPV 15% |
| Annual Avg NSR: | $2,548,331 | Now | $36,965,993 | $21,757,982 | $14,529,393 |
| LOM NSR: | $74,894,902 | 2025 | $35,205,708 | $19,779,984 | $12,634,255 |
| Economic Outcome - Discount Rate: 8.0% - CAD AT NPV: $1.1 billion - Good Speculative Value |
| Gross Rock Value (USD/t): | $138 | Recoverable Rock Value: | $108 | Payable Rock Value: | $108 |
| LOM Net Payable Revenue (USD): | $7,489,490,185 | LOM PT Cash Flow (USD): | $4,628,666,785 | LOM AT Cash Flow (USD): | $3,357,863,250 |
| USD Pre-Tax NPV: | $1,270,435,280 | Pre-Tax IRR: | 40.1% | Pre-Tax Payback: | 2.5 |
| USD After-Tax NPV: | $821,788,487 | After-Tax IRR: | 29.1% | After-Tax Payback: | 3.4 |
| CAD Fair Spec Value Low: | $282,448,703 | CAD Fair Spec Value High: | $564,897,406 | CAD Implied Project Value: | $5,522,369 |
| Price Target if Visualized Outcome delivered by Expl-Dev Cycle without dilution: CAD $12.28 |
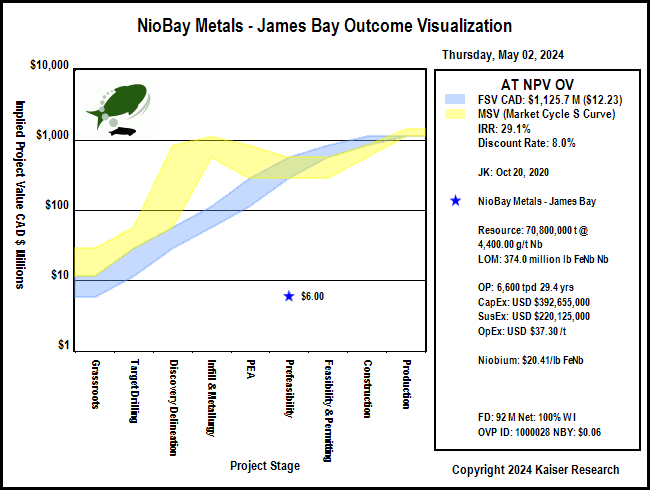 |
| Fair Speculative Value Stock Price Range: CAD $3.07 - $6.14 |
| MSV (Market Cycle S Curve): Market Speculative Value represents the typical market pricing pattern of a new discovery as it moves through its exploration-development cycle. The irrational pricing behavior of the yellow channel contrasts with the fair speculative value of the blue channel as defined by the rational speculation model because during the pre-economic study stages there is great uncertainty about how big the discovery will turn out. |
Fair Speculative Value Ladder
| USD OV NPV | CAD OV NPV | Exch Rate | Diluted | Net Interest |
|---|
| $821,788,487 | $1,129,794,812 | 1.3748 | 92,039,477 | 100.00% |
|---|
| Project Stage | Uncertainty Range | CAD FSV Range | CAD FSV per Share Range | CAD MSV per Share Range |
|---|
| Grassroots |
0.5% - 1.0% |
$5,648,974 - $11,297,948 |
$0.06 - $0.12 |
$0.12 - $0.31 |
| Target Drilling |
1.0% - 2.5% |
$11,297,948 - $28,244,870 |
$0.12 - $0.31 |
$0.31 - $0.61 |
| Discovery Delineation |
2.5% - 5.0% |
$28,244,870 - $56,489,741 |
$0.31 - $0.61 |
$0.61 - $9.21 |
| Infill & Metallurgy |
5% - 10% |
$56,489,741 - $112,979,481 |
$0.61 - $1.23 |
$6.14 - $12.28 |
| PEA |
10% - 25% |
$112,979,481 - $282,448,703 |
$1.23 - $3.07 |
$3.07 - $9.21 |
| Prefeasibility |
25% - 50% |
$282,448,703 - $564,897,406 |
$3.07 - $6.14 |
$3.07 - $6.14 |
| Permitting & Feasibility |
50% - 75% |
$564,897,406 - $847,346,109 |
$6.14 - $9.21 |
$3.07 - $6.14 |
| Construction |
75% - 100% |
$847,346,109 - $1,129,794,812 |
$9.21 - $12.28 |
$6.14 - $9.21 |
| Production |
100% |
$1,129,794,812 |
$12.28 |
$12.28 - $15.34 |
 |
| Market Speculative Value Stock Price Range: CAD $3.07 - $6.14 |
| Warning: while the market spec value (S-Curve) and fair spec value channels presented in project value terms track the evolving expected ultimate outcome value, when presented in stock price terms the expected stock prices are subject to dilution through future equity financings or project interest farmouts. |
| Alternative Metal Price Scenarios |
| Metal 1 | Metal 2 | Metal 3 | Metal 4 |
| Niobium |
|
|
|
| Spot: | $21.25 /lb FeNb |
|
|
| | OV Assigned: | $20.41 /lb FeNb |
|
|
| | Pessimistic: | $15.00 /lb FeNb |
|
|
| | Optimistic: | $22.00 /lb FeNb |
|
|
| | Fantasy: | $25.00 /lb FeNb |
|
|
| | Note: for Metal 1 pessimistic, optimistic and fantasy price scenarios, OV assigned prices are used for Metals 2-4 |
| Economic Outcomes with Alternative Metal Price Scenarios |
| USD PT NPV | USD PT IRR | USD AT NPV | USD AT IRR | AT Payback yrs |
| Spot: | $1,379,171,821 | 42.8% | $897,904,066 | 31.0% | 3.2 |
| OV Assigned: | $1,270,435,280 | 40.1% | $821,788,487 | 29.1% | 3.4 |
| Pessimistic: | $570,120,174 | 22.9% | $331,567,913 | 16.9% | 5.9 |
| Optimistic: | $1,476,258,019 | 45.2% | $965,864,405 | 32.7% | 3.1 |
| Fantasy: | $1,864,602,809 | 54.7% | $1,237,705,758 | 39.3% | 2.5 |
| Fair Speculative Value for Alternative Metal Price Scenarios |
| Stage: Prefeasibility - 25.0% - 50.0% |
| CAD AT NPV | CAD Target Price | CAD FSV Range | CAD FSV per Share Range | CAD MSV per Share Range |
| Spot: | $1,234,438,510 | $13.41 | $308,609,628 - $617,219,255 | $3.35 - $6.71 | $3.35 - $6.71 |
| OV Assigned: | $1,129,794,812 | $12.28 | $282,448,703 - $564,897,406 | $3.07 - $6.14 | $3.07 - $6.14 |
| Pessimistic: | $455,839,567 | $4.95 | $113,959,892 - $227,919,783 | $1.24 - $2.48 | $1.24 - $2.48 |
| Optimistic: | $1,327,870,383 | $14.43 | $331,967,596 - $663,935,192 | $3.61 - $7.21 | $3.61 - $7.21 |
| Fantasy: | $1,701,597,876 | $18.49 | $425,399,469 - $850,798,938 | $4.62 - $9.24 | $4.62 - $9.24 |
| Disclaimer: A visualized outcome is one of many possible outcomes for an exploration project as it moves through the 9 stages of the exploration-development cycle from grassroots to a producing mine with failure as an outcome at any point along the way. The range of possible outcomes for the physical nature of a deposit shrinks after delivery of an initial 43-101 resource estimate. While the nature of the deposit constrains the range of mining scenarios, the cost assumptions will vary as the project moves through the feasibility demonstration stages of the cycle, which affects the economic value of the final outcome. This economic value will also vary according to the prices of the metals targeted for extraction which may change during the years it takes for a project to become a mine. An outcome visualization is thus a compilation of best guess assumptions for the key variables that drive the discounted cash flow model, the basis for assigning an economic value to a mine. An OV is not intended as a prediction, but rather as a framework that allows the incorporation of new information generated by the exploration-development cycle for the project into a valuation model on an ongoing, dynamic basis. |
.
|