| |
Allied Gold Mining plc (ALD-T)
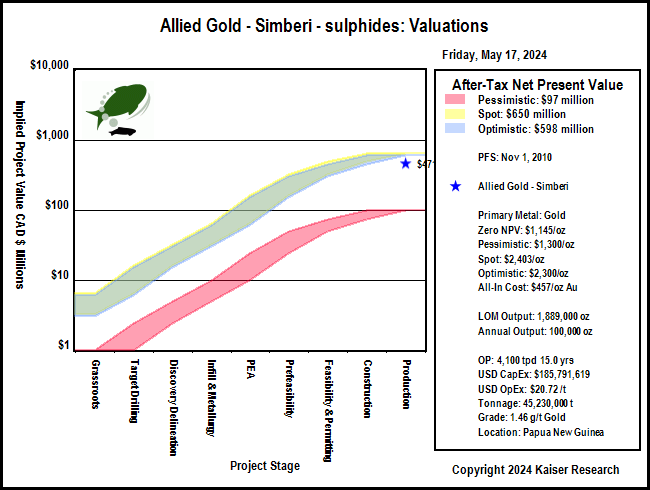
| Allied Gold Mining PLC is an Australian gold producer that listed on the TSX on November 16, 2009. Allied's flagship is the 100-per-cent-owned Simberi oxide gold project which is situated on Simberi Island, the northernmost island of the Tabar Islands group located in the New Ireland province of eastern Papua New Guinea.The company has additional exploration project on the adjacent Tatau and Big Tabar Islands. In 2008-09, Allied Gold produced 80,000 gold ounces at cash costs of (US)$490, and forecasts production to increase to an 100,000 ounces for the fiscal year 2009-10. Allied Gold intends to ramp up total gold production to a further 200,000 ounces by 2013. Allied Gold consolidated its stock 6:1 effective June 30, 2011. In June 2012 the company agreed to be acquired by St. Barbara Ltd. For $1.025 (Australian) in cash and 0.8 St. Barbara share per Allied Gold share. At the time of announcement this represented roughly $2.18 per Allied share, around $450 million on a transaction basis, for the company's gold assets. |

Key to Understanding IPV Charts and Spec Value Hunter Tables
| An IPV Chart is a graphical presentation of a Spec Value Hunter table that has been constructed according to the Rational Speculation Model developed by John Kaiser. The IPV Chart allows speculators to identify which projects offer poor, fair or good speculative value in both absolute and relative terms. The speculative value depends on the project stage, the project's implied value as calculated by the company's fully diluted capitalization, stock price and net project interest, and the dream target deemed appropriate for the project. A dream target is what a project would be worth in discounted cash flow terms once in production. |
| Green background indicates the dream target judged appropriate for this play by John Kaiser - otherwise unranked. |
Poor Speculative Value -   |
Fair Speculative Value -  |
Good Speculative Value -   |
| Note: narrow arrows indicate IPV is outside the fair value channel but within 25% of the fair value limits |
| Click on the company name to view the company profile, the project name to view project details. |
| Click on the project icon if its background is shaded to get the IPV Chart for that company. |
Allied Gold Project Valuations
| Company | Project | Country | Stage | IPV $
MM |
$100 | UPV
$500 |
$2000 | Target Metals | Deposit Style |
| Key Company Projects |
 |
Allied Gold Mining plc (ALD-T) | Simberi |  | Papua New Guinea | Production |
$471 | | |
| Gold | Oxide |
|
|
| Peer Projects |
|
|
|
|
|
|
| Comparable Projects |
|
|
|
|
| Success Stories |
|
|
|
| Simberi |  | 100% WI | Papua New Guinea | 9-Production |
|---|
| Simberi - sulphides 43-101 Economic Study (USD except where noted otherwise) |
| PFS | Nov 1, 2010 |
| Golder Assoc. | Simberi - sulphides |
| Mining Scenario | TR | Mining Costs |
| Mining Type: | OP |
| Cost Currency: | AUD |
| Processing Type: |
|
| Capital Cost: | $278,000,000 |
| Operating Rate: | 4,100 tpd |
| Sustaining Cost: | $0 |
| Operating Days: | 365 |
| Operating Cost: | $31.00/t |
| Strip Rate: | 1.2 |
| BC Cash Cost per Unit: USD | $349/oz Au |
| Mine Life: | 15 years |
| BC Cash Cost Net By-Products: USD | $349/oz Au |
| LOM Tonnage: | 45,230,000 t |
| BC All-In Cost Net By-Prod: USD | $496/oz Au |
| Est Startup: | e 2015 |
| Spot All-In Cost Net By-Prod: USD | $496/oz Au |
| Production Potential |
| Metal 1 | Metal 2 | Metal 3 | Metal 4 |
| Metal: | Au |
|
|
|
| Grade: | 1.46 g/t |
|
|
|
| Recovery: | 84.7% |
|
|
|
| Annual Output: | 100,000 oz |
|
|
|
| LOM Output: | 1,889,000 oz |
|
|
|
| Base Case Price: | $1,000/oz |
|
|
|
| Spot Price: | $1,315/oz |
|
|
|
| Base Case NSR: | $66.82/t |
|
|
|
| Spot NSR: | $87.88/t |
|
|
|
| Base Case Valuation |
| Reported Valuation Currency: | AUD |
| Pre-Tax NPV: | $334,000,000 |
| Discount Rate: | 10% |
| After-Tax NPV: |
|
| Total Base Case NSR USD: | $66.82/t |
| Pre-Tax IRR: | 18% |
| Total Spot NSR USD: | $87.88/t |
| After-Tax IRR: |
|
| Annual Pre-Tax Cash Flow Base Case and Net CF/FDSH USD: | $53,608,500 | $0.31 | Pre-Tax Payback: |
|
| Annual Pre-Tax Cash Flow Spot and Net CF/FDSH USD: | $85,113,500 | $0.46 | After-Tax Payback: | 7.0 y |
| Enterprise Value CAD : | $564,575,049 | $2.69/sh | Share Price: | $2.25 |
| Note: |
| Comparative Valuations using Life of Mine Averages |
| Discount Rate: | 0% | 5% | 10% | 15% |
| Base Case Pre-Tax NPV USD: | $698,512,074 | $444,372,826 | $260,026,611 | $149,161,630 |
| Base Case Pre-Tax Net NPV/Sh USD: | $3.66 | $1.81 | $1.24 | $0.43 |
| Premium BC PT NPV over EV: | $1.57 | ($0.29) | ($0.85) | ($1.67) |
| Spot Pre-Tax NPV USD: | $1,171,087,074 | $755,811,994 | $477,871,643 | $309,354,147 |
| Spot Pre-Tax Net NPV/Sh: | $5.92 | $3.29 | $2.28 | $1.19 |
| Premium Spot PT NPV over EV USD: | $3.82 | $1.20 | $0.19 | ($0.90) |
| The comparative NPV calculations assume constant annual cash flow based on the life of mine average annual payable production and CapEx spent in year one. The operating cost includes the LOM sustaining capital. Due to details such as ore scheduling these NPV figures may differ from those of the 43-101 economic study. |
| After-Tax Valuations using Spot By-Product Prices |
 |
 |
|