Home / Research Tools
Research Tools
| | Corporate Profile: Strateco Resources Inc
Publisher: Kaiser Research Online
Author: Copyright 2013 John A Kaiser
|
| |
Strateco Resources Inc (RSC-T)
| Strateco is a Quebec-focused uranium explorer led by President Guy Herber. The company's flagship is the 30,000 hectare Matoush project, where it is attempting to expand the current 43-10 compliant 16 million pound U308 resource base at this property formerly explored by Uranerz Mining and Cogema in the late 1970s and early 1980s. A November 2008 scoping study on the Matoush project, using a long term uranium price of $75 per pound, envisioned an 800 TPD operation, with a capital cost of $193 million, producing uranium for $27 per pound and yielding an NPV of $341 million at a 5% discount rate. In March 2009 Strateco began a 30,000 meter drill program in an effort to expand and upgrade existing resources at Matoush. Beyond its flagship, Strateco holds a number of additional properties, both in the Otish Basin and across Quebec. After learning in August 2008 that its Matoush property is subject to a permanent moratorium on uranium exploration, uranium mining and uranium waste emplacement in Eeyou Istchee, the James Bay Cree territory, the company looked to acquire new projects elsewhere. In December 2013 the company signed an option to acquire 60% of the Jasper Lake project in the Athabasca Basin from Denison Mines. |

Key to Understanding IPV Charts and Spec Value Hunter Tables
| An IPV Chart is a graphical presentation of a Spec Value Hunter table that has been constructed according to the Rational Speculation Model developed by John Kaiser. The IPV Chart allows speculators to identify which projects offer poor, fair or good speculative value in both absolute and relative terms. The speculative value depends on the project stage, the project's implied value as calculated by the company's fully diluted capitalization, stock price and net project interest, and the dream target deemed appropriate for the project. A dream target is what a project would be worth in discounted cash flow terms once in production. |
| Green background indicates the dream target judged appropriate for this play by John Kaiser - otherwise unranked. |
Poor Speculative Value -   |
Fair Speculative Value -  |
Good Speculative Value -   |
| Note: narrow arrows indicate IPV is outside the fair value channel but within 25% of the fair value limits |
| Click on the company name to view the company profile, the project name to view project details. |
| Click on the project icon if its background is shaded to get the IPV Chart for that company. |
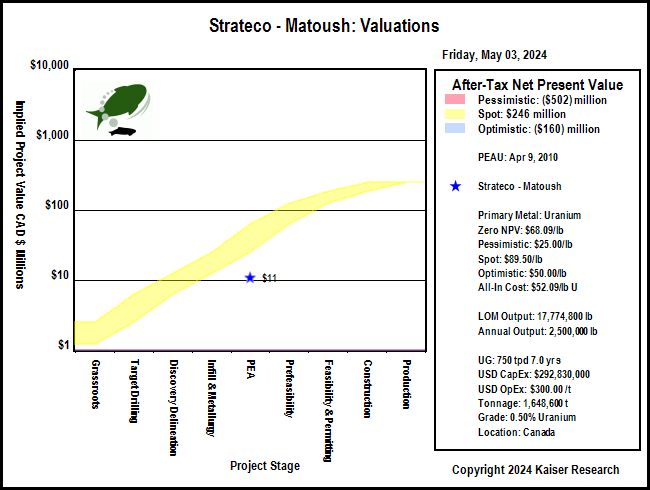
| Matoush |  | 100% WI | Canada | 5-PEA |
|---|
| Matoush 43-101 Economic Study (USD except where noted otherwise) |
| PEAU | Apr 9, 2010 |
| Scott Wilson RPA | Matoush |
| Mining Scenario | TR | Mining Costs |
| Mining Type: | UG |
| Cost Currency: | USD |
| Processing Type: |
|
| Capital Cost: | $292,830,000 |
| Operating Rate: | 750 tpd |
| Sustaining Cost: | $49,126,000 |
| Operating Days: | 365 |
| Operating Cost: | $300.00/t |
| Strip Rate: |
|
| BC Cash Cost per Unit: USD | $32.85/lb U3O8 |
| Mine Life: | 7 years |
| BC Cash Cost Net By-Products: USD | $32.85/lb U3O8 |
| LOM Tonnage: | 1,648,600 t |
| BC All-In Cost Net By-Prod: USD | $52.09/lb U3O8 |
| Est Startup: |
|
| Spot All-In Cost Net By-Prod: USD | $52.09/lb U3O8 |
| Production Potential |
| Metal 1 | Metal 2 | Metal 3 | Metal 4 |
| Metal: | U |
|
|
|
| Grade: | 0.50% |
|
|
|
| Recovery: | 97.6% |
|
|
|
| Annual Output: | 2,500,000 lb |
|
|
|
| LOM Output: | 17,774,800 lb |
|
|
|
| Base Case Price: | $75.00/lb |
|
|
|
| Spot Price: | $21.30/lb |
|
|
|
| Base Case NSR: | $684.93/t |
|
|
|
| Spot NSR: | $194.52/t |
|
|
|
| Base Case Valuation |
| Reported Valuation Currency: | USD |
| Pre-Tax NPV: | $324,000,000 |
| Discount Rate: | 10% |
| After-Tax NPV: |
|
| Total Base Case NSR USD: | $684.93/t |
| Pre-Tax IRR: | 42% |
| Total Spot NSR USD: | $194.52/t |
| After-Tax IRR: |
|
| Annual Pre-Tax Cash Flow Base Case and Net CF/FDSH USD: | $105,375,000 | $0.41 | Pre-Tax Payback: | 2.4 y |
| Annual Pre-Tax Cash Flow Spot and Net CF/FDSH USD: | ($28,875,000) | ($0.15) | After-Tax Payback: |
|
| Enterprise Value CAD : | $29,444,760 | $.12/sh | Share Price: | $0.05 |
| Note: |
| Comparative Valuations using Life of Mine Averages |
| Discount Rate: | 0% | 5% | 10% | 15% |
| Base Case Pre-Tax NPV USD: | $395,669,000 | $263,143,170 | $169,102,791 | $101,196,873 |
| Base Case Pre-Tax Net NPV/Sh USD: | $1.66 | $1.11 | $0.71 | $0.43 |
| Premium BC PT NPV over EV: | $1.57 | $1.01 | $0.61 | $0.33 |
| Spot Pre-Tax NPV USD: | ($544,081,000) | ($476,686,000) | ($425,065,597) | ($384,486,909) |
| Spot Pre-Tax Net NPV/Sh: | ($2.29) | ($2.00) | ($1.79) | ($1.61) |
| Premium Spot PT NPV over EV USD: | ($2.38) | ($2.10) | ($1.88) | ($1.71) |
| The comparative NPV calculations assume constant annual cash flow based on the life of mine average annual payable production and CapEx spent in year one. The operating cost includes the LOM sustaining capital. Due to details such as ore scheduling these NPV figures may differ from those of the 43-101 economic study. |
| After-Tax Valuations using Spot By-Product Prices |
 |
 |
|
| |
| | You can return to the Top of this page
|
|