Blog July 24, 2013: Searching for Leverage to Higher Metal Prices among Juniors
Kaiser Research Online serves a dual purpose of publishing John Kaiser's bottom-fish and spec value hunter recommendations and serving as a platform for "do-it-yourself" research focused on the Canadian listed junior resource sector. While our recommendations have not fared well during the resource equity bear market that began in Q2 of 2011, we have been very productive developing new research tools for KRO members. In Q1 of 2012 we launched the Kaiser Research Online Search Engine which allows members to craft very complex, nuanced searches that can combine over 30 company level and 12 project level parameters. Almost nobody, including many KRO members, appreciate the extraordinary power of the KRO search engine, whose output displays beautifully on an IPAD. In fact, an executive from a resource junior who had been assigned the task of looking for secondary advanced projects owned by distressed juniors was brought to tears when we used the KRO search engine to accomplish in 30 minutes what had taken him two months of tedious Stockwatch news release retrieval starting with a file obtained from the TMX Group that listed most recent working capital positions.
Being able to retrieve hits for a complex query is only half the story; the other half is to present the results in a format that makes it very easy for the searcher to discard the hit or start digging deeper. The Rainy River snapshot above is an example of the 100 plus hits generated by the following KRO Search which looks for companies which have at least $5 million working capital and a project at the PEA stage or higher which hosts a deposit with at least $2 billion in situ value that includes gold as one of the deposit metals. This snapshot tells you how much working capital Rainy River has as of its latest filing, fully diluted stock, what percentage of the issued stock the declared insiders own, who the key officers are, whether the company has a 43-101 resource estimate and is the subject of an open KRO recommendation (see Rec Strategy), a synopsis of the company's focus, and a listing of all gold projects with $2 billion plus in situ value.
The snapshot also includes a multi-year stock chart that shows the timing an approximate size of financings done while still a TSXV listing, the timing of 43-101 resource estimates and economic studies, and formal KRO recommendations (Bottom-Fish Strategy for Rainy River Resources Ltd - August 31, 2012). It's too small to offer any detail, but for experienced speculators the chart pattern in conjunction with the legible price scale speaks volumes. If any of this piques the searcher's interest, he or she can click on the company name to retrieve the KRO Rainy River Profile which contains all sorts of detail. (Sorry, the search and profile links only produce results if you are logged on as an active KRO member.)
While KRO staff is fanatical about accurate data capture, all of which is done manually because a key part of our service is to categorize the information to allow meaningful search retrieval, inputting errors are an unavoidable fact of life. Any KRO member encountering something over the top good or unspeakably horrible would thus want to verify the information, which is why the snapshot's title bar has direct links to the company's web site and its SEDAR filings. KRO does not provide real-time information such as stock prices, which is why there is also a link to MarketWatch's Big Charts Quote. You will also notice the forum link which will take you to Marcus New's Rainy River Stockhouse Bullboard. The unstructured nature of a stock forum means that many of the postings will be drivel from drunken pumpers and bashers, but a serious researcher can glean much from parsing these ramblings. Within all that noise there are signals such as the degrees of stress, frustration, and exuberance. Stock forums tend to attract axe grinders who often float information about internal conflicts or controversies into public view. These signals stand out starkly against the noise, but to see them you have to filter everything. Even silence on the thread conveys useful information, especially for establishing baselines against which future noise can be interpreted.
There is also a link to the Rainy River People Tree, a KRO search feature we created during the 2008 crash. When a friend who is an investor relations specialist saw me demonstrate how the People Tree not only showed how the resource sector people are interconnected and what their track records looked like, but also put reams of detailed current information about their companies at his fingertips, he gasped at me, "don't show this to anybody". Some stock-pickers like to declare, it's all about the people. The reality is that unless you are embedded in the industry it is very difficult to assess the track record of a resource junior's management. One newsletter marketing strategy is thus one of disempowering the speculator by educating him or her about the necessity of knowing all about the "people", which, of course, is not feasible for speculators with a real job in another sector. But newsletter writers can offer a shortcut, because they know who the "good people" are. They even make them members of special "leagues" where eligibility suspiciously looks like a function of availability of cheap seed or private placement paper in future machine plays. That is, for the newsletter writers, not their audience which gets invited down the road to serve as an after market. Through the People Tree system Kaiser Research Online makes it easy for KRO members to figure out management track records, and to assess whether a group's flag is flying, drooping or in tatters. (A bottom-fishing secret is to look for the tatters of former flappers, because often these flags get shredded by a change in wind direction such as the bear market since Q2 of 2011. The ones to avoid are those whose flags droop even during bull markets, which typically is the case for the so called "life-style" or "pretend explorationists" that have polluted the Canadian junior resource sector during the past decade and who represent a good chunk of the 768 juniors with less than $200,000 working capital that are threatened with extinction during the next 12 months unless there is a miraculous rebound in the price of gold.)
The only item not mentioned in the Rainy River search snapshot is the IPV, which finally brings us to the purpose of this update, namely the official roll-out of the KRO Economic Study system. We have not published much during the past few months, partly because whenever we dared to say anything positive about a junior it proved expensive to anybody who listened, but largely because we have been very busy compiling the basic parameters of more than 400 economic studies published since 2005. This task is now complete for the main metals like gold, silver, copper, nickel and zinc.
The serious junior resource sector divides into two basic types of companies: those who are trying to make a major discovery that will be very economic at current and even lower metal prices, and those which are trying to demonstrate that existing deposits are feasible as mines at current metal prices, and fabulously valuable at higher real metal prices while costs remain constant. The latest KRO innovation makes it easier to understand the speculative leverage implicit in the second group which has invested tens of million dollars producing 43-101 compliant resource estimates and economic studies such as preliminary economic assessments (PEA with 30-35% error margins), prefeasibility studies (PFS with 20-25% error margin) and feasibility studies (FS with 10-15% error margins). During the 2008-2009 financial crisis KRO developed a way of capturing 43-101 resource estimates and tracking their rock and overall in situ values based on spot and 3 year trailing average metal prices which can be viewed by KRO members in various sort orders through our Resource Tables. The trouble with resource estimates is that, although they are supposed to be created in the context of commercial viability, they really are just a scientific description of a deposit at various cutoff grades. And I see nothing wrong with that, because nominal metal prices and underlying extraction costs have no formal relationship.
On the one hand a resource junior can undergo over hundredfold price increases because a "Big Anomaly" gets turned into a fabulous world class discovery. And unfortunately such outcomes are few and far between. But on the other hand resource juniors can undergo ten-fold or better price gains when a metal undergoes a considerably smaller percentage real price gain. The tragedy of the past decade, particularly in the gold sector, is that the dominant narrative has been about higher nominal metal prices due to such forces as the debasement of "fiat currencies" and the "hyper-inflation" consequences of "big government" policies. None of these predictions have materialized, but, ironically, in the mining sector mining costs have undergone much higher cost inflation than general levels of inflation, with the result that the profit that should have been available for harvesting as a result of $3 plus copper and $1,500 plus gold have evaporated. In the case of gold, we have had to deal with a sharp price retreat to levels where almost all of the advanced gold projects of the juniors have negative or negligible economic values. (See Was the Smackdown about Gold or the Apocalyptic Gold Bug Narrative? - April 29, 2013 for my analysis about the wrong-headedness of the dominant gold bug narrative.)
While resource estimates quantify the grade and size of a deposit, economic studies quantify the cost side of the mining equation. Each economic study involves a mining plan that has been tweaked to produce the best possible result in terms of net present value (the cash flow in each year of mine's life is discounted to the present at a discount rate, including the "negative" upfront capital cost) and the internal rate of return (the "discount rate" at which the net present value equals zero). Tweaking involves a mining plan that tries to process higher grade ore during the early years, tricky tax treatments, and strategies to incur capital and sustaining costs in stages. It also involves assumptions for base case metal prices, which can be rather wonky for by-product metals, and rather unconservative choices for discount rates such as 5%. Missing from the valuations, which rely on the discounted cash flow method, is a separate discount for the time delay before commercial production is likely to begin. To a large degree the market has ignored the outcomes of economic studies, except when they are very negative, in which case the stock gets pummeled.
Although gold only broke down in April 2013, the gold equities have been in a downtrend since the start of 2011, perhaps foreshadowing a market premonition that there was no linkage between the physics of gold mining and gold bug hyperbole. The gold smackdown, however, has created a capitulation sell-off in gold equities which means that some gold juniors offer extraordinary upside leverage for a simple rebound by gold into the $1,600-$2,000 range. To get a grasp of the leverage implied by individual deposits we have simplified the mining plans into life of mine averages where costs and grades are constant throughout the mine life. We have applied spot prices to all by-product metals, and then run the DCF model at various prices for the primary metal to generate the corresponding net present values (NPV) and internal rates of return (IRR). To create comparable after-tax values we have applied a 30% tax rate to profit remaining after deducting depreciation calculated as a double declining balance applied to the initial capital cost. Where companies have listed a life of mine sustaining cost, we have averaged the total and expensed it annually as part of the operating cost. We have used a 10% discount rate across the board. NPV values are stated on a 100% basis, but NPV per share figures reflect the company's net interest in the project divided by fully diluted stock. The results may deviate somewhat from what the 43-101 reports present as their economic valuations, but we are only presenting them for comparative purposes. Once a project has caught the attention of a KRO member, one must still construct a detailed model that takes into account the study's ore and capital cost schedules.
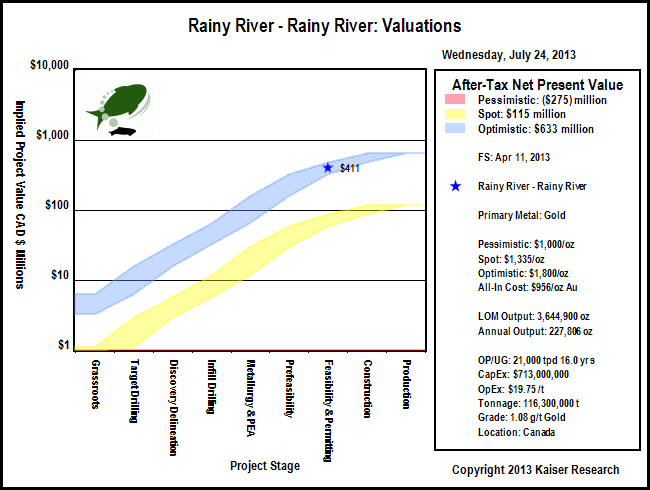
The chart above shows how Rainy River's net NPV per share and IRR vary with the price of gold. We have adopted $1,000 gold as a pessimistic price target, $1,800 as an optimistic target, and $2,500 as a fantasy target (We use the term "fantasy" in the context of gold stabilizing at $2,500 per oz without any accompanying cost inflation; we are not saying that the risk of fiat currency debasement is "fantasy". But we wish to make the point that a fiat currency debasement driven rise in the price of gold does not expand the profitability of mining an ounce still in the ground.) Rainy River is currently the subject of a friendly takeover bid by New Gold Inc which on May 31, 2013 offered 0.5 New Gold share or $3.83 cash for each Rainy River share, valuing the company at $411 million, which, after subtracting $85 million working capital as of March 31, implies a value of $326 million for the project, effectively a price expectation of $1,500 per oz for gold. The implied project value chart below shows how the market is current pricing the Rainy River project on a 100% basis, assuming that all other assets such as the $85 million working will be used up advancing the project to construction. The colored bands represent the fair value channels as defined by the uncertainty ladder that underlies the rational speculation model, with references to the after-tax NPV outcome as defined by the pessimistic, spot and optimistic gold prices. This makes it clear that Rainy River is being priced for the optimistic outcome of $1,800 gold. A project at the feasibility-permitting stage has a fair value in the range of 50% to 75% of the NPV value when in production, which reflects the remaining development uncertainty. (A future KRO improvement will be to include the years until estimated production startup in calculting the NPV.)
The study sensitivity and speculative value charts together offer a very efficient way to visually detect both good and poor speculative value among advanced ounce or pound in the ground resource juniors., the former as upside leveraged buying opportunities, and the latter as potential shorts. If you click on the sensitivity chart KRO will load the company's profile and display the section which has the details of that economic study. And in keeping with the principle that the annual $800 cost of a KRO membership is a really a time saving expense, the study section includes a link to the actual 43-101 technical report which provides all the gory and often convoluted details that make up an economic study. For a quick tour of all the advanced gold projects for which economic studies have been published, click on After-Tax Gold Project Valuations.