Home / Companies / KRO Focus
KRO Focus
| Outcome Visualization Project as of Apr 23, 2024: Discovery Harbour: Fortuity 89 |
| Project: | Fortuity 89 | Location: | United States | Stage: | 2-Target Drilling |
| Net Interest: | 100% WI | Uncapped NSR: | 0.0% | Target Metals: | Gold Silver |
| OV Project ID: | 1000032 | OVP Posted: | 9/1/2021 | OVP Retired: |
|
| Current OV ID: | 1000086 | Current OV Confirmed: | 9/1/2021 | Visualizer: | JK |
Issued
9,450,929 |
Price
$0.130 |
Working Capital
($6,332) |
Key People: Darren Collins (CEO), Clayton Fisher (CFO), |
Diluted
10,058,429 |
Insiders
16.2% |
As of
12/31/2023 |
 |  |
| Visualized Outcome: Discovery Harbour: Fortuity 89 - 1,500 tpd UG Sleeper Clone |
| The Fortuity 89 project owned by Discovery Harbour and optioned 75% to Newcrest is centered on a silicified outcrop within a gravel covered basin in Nevada's Walker Lane. The outcrop bears alteration evidence for the upper reaches of a low sulphidation epithermal system and has been the focus of shallow drilling in the past that failed to intersect gold mineralization. Although surface sampling yields gold values less than 50 ppb, the speculative question is whether or not this LSE system was fertile with gold. Geophysics has identified a N-S oriented structural zone with a strike of 1.6 km for which Newcrest has proposed a 7 hole RC drill program to test at depths of 300-500 m. The analogue target is the Sleeper deposit whose high grade set of veins was mined in 1986-1996 by Amax by open pit and milled with 90%-95% recovery to produce 1,219,880 oz gold. About 45 million t of lower grade stockwork ore averaging 0.7 g/t gold was heap leached with a 49% recovery to produce 438,609 oz gold. Total throughput for a mill with initial 500 tpd capacity is not available but head grade seems to have ranged 10-15 g/t annually. The lower grade material averaging 0.4 g/t still in place has been the subject of modern economic studies. Because gold at Fortuity89 is not likely to be present close enough to be open-pit mineable, only the high grade structurally controlled aspect of the Sleeper system is considered as an underground mineable target. |
| Visualized Outcome Summary: Discovery Harbour: Fortuity 89 - 1,500 tpd UG Sleeper Clone |
| Deposit Scenario: 4,000,000 t @ 13.00 g/t Gold |
| Mining Scenario: Underground 1,500 tpd 7.3 yrs, CapEx $200.0 million, SustCapEx $40.0 million, OpEx $123.00/t (USD) |
| LOM Payable: 1.5 million oz gold |
| Economic Outcome (USD): Revenue Model at OV designated Metal Prices |
| Annual Average | Life of Mine (LOM) | LOM Stats |
| Recoverable Revenue: | $495,532,138 | $3,620,326,124 | $905/t ore Recoverable Value: |
| Smelter/Transport Costs: | ($4,955,321) | ($36,203,261) | 1.0% of Recoverable Revenue |
| Gross Payable Revenue: | $490,576,817 | $3,584,122,863 | 99.0% of Recoverable Revenue |
| Royalties: | $0 | $0 | 0.0% of Gross Payable Revenue |
| Net Payable Revenue: | $490,576,817 | $3,584,122,863 | 99.0% of Recoverable Revenue |
| Mining Cost: | ($54,750,000) | ($400,000,000) | 75% of OpEx - $100.00/t ore |
| Processing Cost: | ($10,950,000) | ($80,000,000) | 15% of OpEx - $20.00/t ore |
| Other Cost: | ($1,642,500) | ($12,000,000) | 2% of OpEx - $3.00/t ore |
| Sustaining Cost: | ($5,000,000) | ($40,000,000) | 8% of OpEx - $10.00/t ore |
| Total Operating Cost: | ($72,342,500) | ($532,000,000) | 15% of Net Payable Revenue - OpEx - $133.00/t ore |
| Pre-Tax Cash Flow: | $418,234,317 | $3,052,122,863 | 85% of Net Payable Revenue - $763.03/t ore |
| Taxes: | ($97,415,722) | ($713,030,716) | 23% of Pre-Tax Cash Flow - $178.26/t ore
|
| After-Tax Cash Flow: | $320,818,595 | $2,339,092,147 | 65% of Net Payable Revenue - $584.77/t ore |
| Note: Concentrate transport costs, smelter treatment costs and retention are subtracted from recoverable revenue to get gross payable revenue to which the uncapped royalty rate for the project is applied. The annual average of LOM sustaining cost is expensed as an annual operating cost. Annual average figures reflect full production years. |
| Economic Outcome (USD): Royalty Model for 1% NSR at OV designated Metal Prices |
| Mine Life: | 8 years | Startup | NPV 5% | NPV 10% | NPV 15% |
| Annual Avg NSR: | $4,905,768 | Now | $28,002,325 | $22,348,629 | $18,174,509 |
| LOM NSR: | $35,841,229 | 2025 | $26,668,881 | $20,316,936 | $15,803,921 |
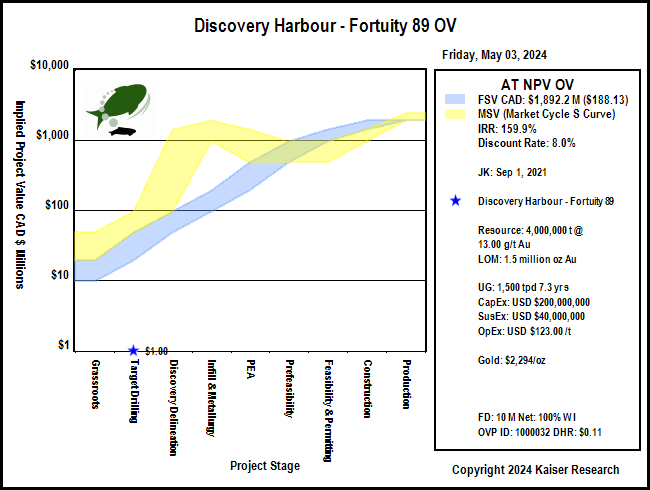
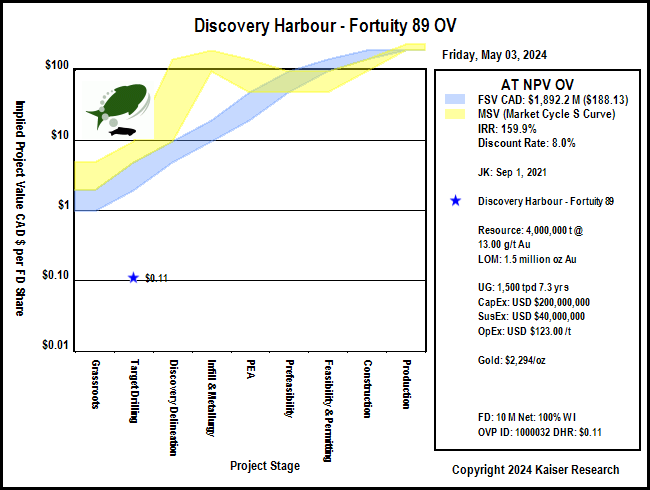
| Economic Outcome - Discount Rate: 8.0% - CAD AT NPV: $1.9 billion - Good Speculative Value |
| Gross Rock Value (USD/t): | $973 | Recoverable Rock Value: | $905 | Payable Rock Value: | $896 |
| LOM Net Payable Revenue (USD): | $3,584,122,863 | LOM PT Cash Flow (USD): | $3,052,122,863 | LOM AT Cash Flow (USD): | $2,339,092,147 |
| USD Pre-Tax NPV: | $1,893,274,745 | Pre-Tax IRR: | 209.1% | Pre-Tax Payback: | 0.5 |
| USD After-Tax NPV: | $1,410,751,448 | After-Tax IRR: | 162.6% | After-Tax Payback: | 0.6 |
| CAD Fair Spec Value Low: | $19,289,205 | CAD Fair Spec Value High: | $48,223,011 | CAD Implied Project Value: | $1,307,596 |
| Price Target if Visualized Outcome delivered by Expl-Dev Cycle without dilution: CAD $191.77 |
 |
| Fair Speculative Value Stock Price Range: CAD $1.92 - $4.79 |
| MSV (Market Cycle S Curve): Market Speculative Value represents the typical market pricing pattern of a new discovery as it moves through its exploration-development cycle. The irrational pricing behavior of the yellow channel contrasts with the fair speculative value of the blue channel as defined by the rational speculation model because during the pre-economic study stages there is great uncertainty about how big the discovery will turn out. |
Fair Speculative Value Ladder
| USD OV NPV | CAD OV NPV | Exch Rate | Diluted | Net Interest |
|---|
| $1,410,751,448 | $1,928,920,454 | 1.3673 | 10,058,429 | 100.00% |
|---|
| Project Stage | Uncertainty Range | CAD FSV Range | CAD FSV per Share Range | CAD MSV per Share Range |
|---|
| Grassroots |
0.5% - 1.0% |
$9,644,602 - $19,289,205 |
$0.96 - $1.92 |
$1.92 - $4.79 |
| Target Drilling |
1.0% - 2.5% |
$19,289,205 - $48,223,011 |
$1.92 - $4.79 |
$4.79 - $9.59 |
| Discovery Delineation |
2.5% - 5.0% |
$48,223,011 - $96,446,023 |
$4.79 - $9.59 |
$9.59 - $143.83 |
| Infill & Metallurgy |
5% - 10% |
$96,446,023 - $192,892,045 |
$9.59 - $19.18 |
$95.89 - $191.77 |
| PEA |
10% - 25% |
$192,892,045 - $482,230,114 |
$19.18 - $47.94 |
$47.94 - $143.83 |
| Prefeasibility |
25% - 50% |
$482,230,114 - $964,460,227 |
$47.94 - $95.89 |
$47.94 - $95.89 |
| Permitting & Feasibility |
50% - 75% |
$964,460,227 - $1,446,690,341 |
$95.89 - $143.83 |
$47.94 - $95.89 |
| Construction |
75% - 100% |
$1,446,690,341 - $1,928,920,454 |
$143.83 - $191.77 |
$95.89 - $143.83 |
| Production |
100% |
$1,928,920,454 |
$191.77 |
$191.77 - $239.71 |
 |
| Market Speculative Value Stock Price Range: CAD $4.79 - $9.59 |
| Warning: while the market spec value (S-Curve) and fair spec value channels presented in project value terms track the evolving expected ultimate outcome value, when presented in stock price terms the expected stock prices are subject to dilution through future equity financings or project interest farmouts. |
| Alternative Metal Price Scenarios |
| Metal 1 | Metal 2 | Metal 3 | Metal 4 |
| Gold |
|
|
|
| Spot: | $2,328 /oz |
|
|
| | OV Assigned: | $2,328 /oz |
|
|
| | Pessimistic: | $1,300 /oz |
|
|
| | Optimistic: | $2,300 /oz |
|
|
| | Fantasy: | $3,000 /oz |
|
|
| | Note: for Metal 1 pessimistic, optimistic and fantasy price scenarios, OV assigned prices are used for Metals 2-4 |
| Economic Outcomes with Alternative Metal Price Scenarios |
| USD PT NPV | USD PT IRR | USD AT NPV | USD AT IRR | AT Payback yrs |
| Spot: | $1,893,274,745 | 209.1% | $1,410,751,448 | 162.6% | 0.6 |
| OV Assigned: | $1,893,274,745 | 209.1% | $1,410,751,448 | 162.6% | 0.6 |
| Pessimistic: | $815,549,963 | 100.1% | $602,457,861 | 79.7% | 1.2 |
| Optimistic: | $1,863,461,657 | 206.1% | $1,388,391,632 | 160.3% | 0.6 |
| Fantasy: | $2,596,999,844 | 279.8% | $1,938,545,272 | 215.9% | 0.5 |
| Fair Speculative Value for Alternative Metal Price Scenarios |
| Stage: Target Drilling - 1.0% - 2.5% |
| CAD AT NPV | CAD Target Price | CAD FSV Range | CAD FSV per Share Range | CAD MSV per Share Range |
| Spot: | $1,928,920,454 | $191.77 | $19,289,205 - $48,223,011 | $1.92 - $4.79 | $4.79 - $9.59 |
| OV Assigned: | $1,928,920,454 | $191.77 | $19,289,205 - $48,223,011 | $1.92 - $4.79 | $4.79 - $9.59 |
| Pessimistic: | $823,740,633 | $81.90 | $8,237,406 - $20,593,516 | $0.82 - $2.05 | $2.05 - $4.09 |
| Optimistic: | $1,898,347,878 | $188.73 | $18,983,479 - $47,458,697 | $1.89 - $4.72 | $4.72 - $9.44 |
| Fantasy: | $2,650,572,950 | $263.52 | $26,505,729 - $66,264,324 | $2.64 - $6.59 | $6.59 - $13.18 |
| Disclaimer: A visualized outcome is one of many possible outcomes for an exploration project as it moves through the 9 stages of the exploration-development cycle from grassroots to a producing mine with failure as an outcome at any point along the way. The range of possible outcomes for the physical nature of a deposit shrinks after delivery of an initial 43-101 resource estimate. While the nature of the deposit constrains the range of mining scenarios, the cost assumptions will vary as the project moves through the feasibility demonstration stages of the cycle, which affects the economic value of the final outcome. This economic value will also vary according to the prices of the metals targeted for extraction which may change during the years it takes for a project to become a mine. An outcome visualization is thus a compilation of best guess assumptions for the key variables that drive the discounted cash flow model, the basis for assigning an economic value to a mine. An OV is not intended as a prediction, but rather as a framework that allows the incorporation of new information generated by the exploration-development cycle for the project into a valuation model on an ongoing, dynamic basis. |
.
|