Home / Works Archive / Trackers
Trackers
| | Mon May 10, 2021
Outcome Visualization Project as of May 10, 2021: Sonoro - Cerro Caliche HL OP Scenario
Publisher: Kaiser Research Online
Author: Copyright 2021 John A. Kaiser
|
| |
| Outcome Visualization Project as of May 10, 2021: Sonoro - Cerro Caliche HL OP Scenario |
| Project: | Cerro Caliche | Location: | Mexico | Stage: | 4-Infill Drilling |
| Net Interest: | 100% WI | Uncapped NSR: | 0.0% | Target Metals: | Gold Silver |
| OV Project ID: | 1000027 | OVP Posted: | 8/9/2020 | OVP Retired: |
|
| Current OV ID: | 1000076 | Current OV Confirmed: | 5/7/2021 | Visualizer: | JK |
Issued
102,370,593 |
Price
$0.225 |
Working Capital
$3,877,561 |
Key People: Kenneth MacLeod (CEO), John M. Darch (Chair), Salil Dhaumya (CFO), Jorge Diaz (VP OP), Neil H. Maedel (VP FI), Melvin A. Herdrick (VP EX), Katharine E. Regan (Sec) |
Diluted
166,518,420 |
Insiders
11.8% |
As of
9/30/2020 |
 |  |
| Visualized Outcome: Sonoro: Cerro Caliche 15,000 tpd HL OP Scenario |
| The Cerro Caliche project hosts four parallel trends of low sulphidation epithermal mineralization called Cabeza Blanca-El Colorado, Buena Suerte, Japoneses, and El Rincon-Veta de Oro which have been the focus of past artisanal mining that targeted the higher grade veins within this system oxidized to a depth of at least 200 m. Several groups including Cambior have explored the property since the 1990s with the goal of outlining a low grade open-pittable heap leachable resource but these efforts were hampered by fragmented ownership. The Japoneses zone yielded a 43-101 resource estimate in 2019 consisting of inferred 11,470,000 tonnes at 0.5 g/t gold and 4.3 g/t silver. Preliminary met studies indicated heap leach recoveries of 72% for gold and 30% for silver. The mineralization consists of veinlets typical of the upper portions of an LSE system; some core drilling was undertaken in 2020 to test the potential for deeper bonanza grades in the boiling zone but management decided to concentrate on shallow RC drilling to delineate a resource large enough to support a 15,000 tpd open-pit heap leach operation for at least 5 years. The company expects to deliver an updated resource estimate and PEA by August 2021 which it believes will support 5-6 years of production from the Buena Suerte and Japoneses trends. We are expecting an inferred resource in the 27-33 million tonne range. It also believes it will secure a mining permit by Q4 of 2021, and, assuming it can get a production loan, possibly from an EPC entity, can get construction underway in late 2021 and be heap leaching by H2 of 2022 with a goal of minimum 50,000 oz gold output per year. Sonoro will use cash flow to delineate the flanking Cabeza Blanca-El Colorado and El Rincon-Veta de Oro zones, which appear to have higher grade potential, to extend the mine life. An earlier OV published on Aug 9, 2020 envisioned a scenario where a series of open pits can be mined and heap leached at 15,000 tpd for a total resource of 75 million tonnes at 0.4 g/t gold and 4 g/t silver mined over 14 years. The cost assumptions were based on Argonaut's PEA for its San Agustin project. Since mid 2020 Sonoro has raised $11 million which funded a drill program that brought the project total to 443 holes (47,557 m) as of April 2021. The higher drill density in the Buena Suerte and Japoneses zones has boosted optimism for a grade in the 0.5-0.6 g/t gold range. In this updated OV it is assumed that the original tonnage goal of 75 million tonnes with a LOM grade of 0.55 g/t gold will be achieved as the flanking zones get developed. A lower CapEx and Sustaining Capital than Argonaut's San Agustin was adopted to reflect lower crushing intensity and a plan to use contract mining, though this has led to a higher OpEx than San Agustin. The plan to combine the Buena Suerte and Japoneses zones into a single pit has increased the strip rate into the 2-3:1 range so 2.5:1 has been adopted. Gold recovery has been boosted from 72% to 75%. The purpose of this OV is to create a speculative scenario and valuation ahead of the 43-101 PEA. |
| Visualized Outcome Summary: Sonoro: Cerro Caliche 15,000 tpd HL OP Scenario |
| Deposit Scenario: 75,000,000 t @ 0.55 g/t Gold, 4.00 g/t Silver |
| Mining Scenario: Open Pit 15,000 tpd 13.7 yrs, CapEx $25.0 million, SustCapEx $15.0 million, OpEx $12.75/t (USD), AISC $13.28/t (USD) |
| LOM Payable: 975,000 oz gold, 2.8 million oz silver |
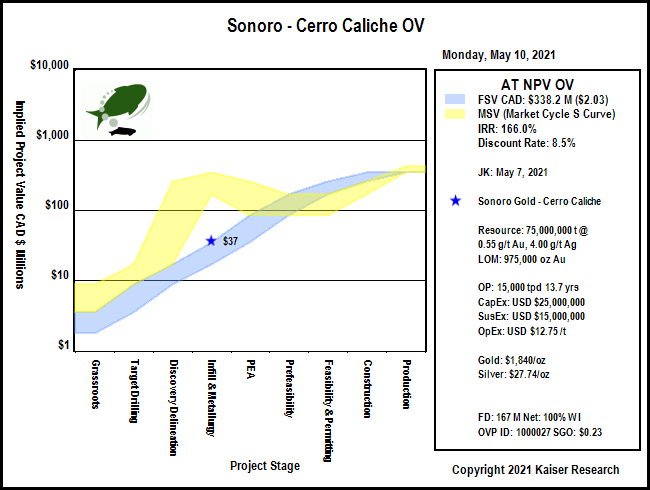
| Economic Value (after-tax): IRR 166.0%, Payback 0.6 yrs, NPV at 8.5% - USD $279,652,077, Future Price/sh: CAD $2.03 |
| Economic Outcome - Discount Rate: 8.5% - CAD AT NPV: $338.0 million - Poor Speculative Value |
| Gross Rock Value (USD/t): | $36 | Recoverable Rock Value: | $25 | Payable Rock Value: | $25 |
| LOM CapEx & Sustaining Cost: | $40,000,000 | LOM Operating Cost: | $956,250,000 | AISC per tonne: | $13.28 |
| LOM Net Payable Revenue (USD): | $1,872,693,235 | LOM PT Cash Flow (USD): | $901,443,235 | LOM AT Cash Flow (USD): | $568,394,805 |
| USD Pre-Tax NPV: | $457,015,315 | Pre-Tax IRR: | 263.3% | Pre-Tax Payback: | 0.4 |
| USD After-Tax NPV: | $279,652,077 | After-Tax IRR: | 166.0% | After-Tax Payback: | 0.6 |
| CAD Fair Spec Value Low: | $16,911,959 | CAD Fair Spec Value High: | $33,823,919 | CAD Implied Project Value: | $37,466,645 |
| Price Target if Visualized Outcome delivered by Expl-Dev Cycle without dilution: CAD $2.03 |
| Economic Outcome (USD): Revenue Model at OV designated Metal Prices |
| Annual Average | Life of Mine (LOM) | LOM Stats |
| Recoverable Revenue: | $139,496,537 | $1,910,911,464 | $25/t ore Recoverable Value: |
| Smelter/Transport Costs: | ($2,789,931) | ($38,218,229) | 2.0% of Recoverable Revenue |
| Gross Payable Revenue: | $136,706,606 | $1,872,693,235 | 98.0% of Recoverable Revenue |
| Royalties: | $0 | $0 | 0.0% of Gross Payable Revenue |
| Net Payable Revenue: | $136,706,606 | $1,872,693,235 | 98.0% of Recoverable Revenue |
| Mining Cost: | ($28,743,750) | ($393,750,000) | 41% of OpEx - $5.25/t ore |
| Processing Cost: | ($38,325,000) | ($525,000,000) | 54% of OpEx - $7.00/t ore |
| Other Cost: | ($2,737,500) | ($37,500,000) | 4% of OpEx - $0.50/t ore |
| Sustaining Cost: | ($1,071,429) | ($15,000,000) | 2% of OpEx - $0.20/t ore |
| Total Operating Cost: | ($70,877,679) | ($971,250,000) | 52% of Net Payable Revenue - OpEx - $12.95/t ore |
| Pre-Tax Cash Flow: | $65,828,928 | $901,443,235 | 48% of Net Payable Revenue - $12.02/t ore |
| Taxes: | ($24,321,492) | ($333,048,429) | 37% of Pre-Tax Cash Flow - $4.44/t ore
|
| After-Tax Cash Flow: | $41,507,435 | $568,394,805 | 30% of Net Payable Revenue - $7.58/t ore |
| Note: Concentrate transport costs, smelter treatment costs and retention are subtracted from recoverable revenue to get gross payable revenue to which the uncapped royalty rate for the project is applied. The annual average of LOM sustaining cost is expensed as an annual operating cost. Annual average figures reflect full production years. |
| Economic Outcome (USD): Royalty Model for 1% NSR at OV designated Metal Prices |
| Mine Life: | 14 years | Startup | NPV 5% | NPV 10% | NPV 15% |
| Annual Avg NSR: | $1,367,066 | Now | $12,689,535 | $9,056,598 | $6,754,357 |
| LOM NSR: | $18,726,932 | 2022 | $12,085,272 | $8,233,271 | $5,873,353 |
 |
| Fair Speculative Value Stock Price Range: CAD $0.10 - $0.20 |
| MSV (Market Cycle S Curve): Market Speculative Value represents the typical market pricing pattern of a new discovery as it moves through its exploration-development cycle. The irrational pricing behavior of the yellow channel contrasts with the fair speculative value of the blue channel as defined by the rational speculation model because during the pre-economic study stages there is great uncertainty about how big the discovery will turn out. |
Fair Speculative Value Ladder
| USD OV NPV | CAD OV NPV | Exch Rate | Diluted | Net Interest |
|---|
| $279,652,077 | $338,239,188 | 1.2095 | 166,518,420 | 100.00% |
|---|
| Project Stage | Uncertainty Range | CAD FSV Range | CAD FSV per Share Range | CAD MSV per Share Range |
|---|
| Grassroots |
0.5% - 1.0% |
$1,691,196 - $3,382,392 |
$0.01 - $0.02 |
$0.02 - $0.05 |
| Target Drilling |
1.0% - 2.5% |
$3,382,392 - $8,455,980 |
$0.02 - $0.05 |
$0.05 - $0.10 |
| Discovery Delineation |
2.5% - 5.0% |
$8,455,980 - $16,911,959 |
$0.05 - $0.10 |
$0.10 - $1.52 |
| Infill & Metallurgy |
5% - 10% |
$16,911,959 - $33,823,919 |
$0.10 - $0.20 |
$1.02 - $2.03 |
| PEA |
10% - 25% |
$33,823,919 - $84,559,797 |
$0.20 - $0.51 |
$0.51 - $1.52 |
| Prefeasibility |
25% - 50% |
$84,559,797 - $169,119,594 |
$0.51 - $1.02 |
$0.51 - $1.02 |
| Permitting & Feasibility |
50% - 75% |
$169,119,594 - $253,679,391 |
$1.02 - $1.52 |
$0.51 - $1.02 |
| Construction |
75% - 100% |
$253,679,391 - $338,239,188 |
$1.52 - $2.03 |
$1.02 - $1.52 |
| Production |
100% |
$338,239,188 |
$2.03 |
$2.03 - $2.54 |
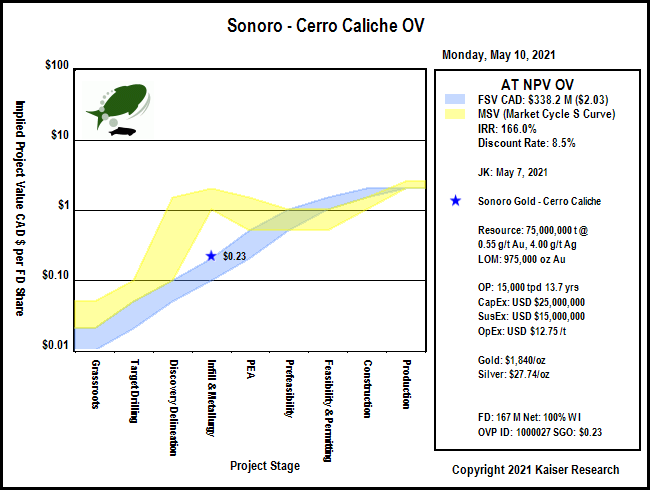 |
| Market Speculative Value Stock Price Range: CAD $1.02 - $2.03 |
| Warning: while the market spec value (S-Curve) and fair spec value channels presented in project value terms track the evolving expected ultimate outcome value, when presented in stock price terms the expected stock prices are subject to dilution through future equity financings or project interest farmouts. |
| Alternative Metal Price Scenarios |
| Metal 1 | Metal 2 | Metal 3 | Metal 4 |
| Gold | Silver |
|
|
| Spot: | $1,840 /oz | $27.74 /oz |
|
| | OV Assigned: | $1,840 /oz | $27.74 /oz |
|
| | Pessimistic: | $1,300 /oz | $27.74 /oz |
|
| | Optimistic: | $2,300 /oz | $27.74 /oz |
|
| | Fantasy: | $3,000 /oz | $27.74 /oz |
|
| | Note: for Metal 1 pessimistic, optimistic and fantasy price scenarios, OV assigned prices are used for Metals 2-4 |
| Economic Outcomes with Alternative Metal Price Scenarios |
| USD PT NPV | USD PT IRR | USD AT NPV | USD AT IRR | AT Payback yrs |
| Spot: | $457,015,315 | 263.3% | $279,652,077 | 166.0% | 0.6 |
| OV Assigned: | $457,015,315 | 263.3% | $279,652,077 | 166.0% | 0.6 |
| Pessimistic: | $176,506,890 | 109.5% | $105,736,854 | 70.6% | 1.4 |
| Optimistic: | $695,534,414 | 394.1% | $427,533,919 | 247.1% | 0.4 |
| Fantasy: | $1,058,853,680 | 593.4% | $652,791,864 | 370.7% | 0.3 |
| Fair Speculative Value for Alternative Metal Price Scenarios |
| Stage: Infill & Metallurgy - 5.0% - 10.0% |
| CAD AT NPV | CAD Target Price | CAD FSV Range | CAD FSV per Share Range | CAD MSV per Share Range |
| Spot: | $338,239,188 | $2.03 | $16,911,959 - $33,823,919 | $0.10 - $0.20 | $1.02 - $2.03 |
| OV Assigned: | $338,239,188 | $2.03 | $16,911,959 - $33,823,919 | $0.10 - $0.20 | $1.02 - $2.03 |
| Pessimistic: | $127,888,725 | $0.77 | $6,394,436 - $12,788,872 | $0.04 - $0.08 | $0.38 - $0.77 |
| Optimistic: | $517,102,274 | $3.11 | $25,855,114 - $51,710,227 | $0.16 - $0.31 | $1.55 - $3.11 |
| Fantasy: | $789,551,759 | $4.74 | $39,477,588 - $78,955,176 | $0.24 - $0.47 | $2.37 - $4.74 |
| Detailed Visualized Outcome (KRO Members Only) |
| VU = Very Unsure |
SU = Somewhat Unsure |
SS = Somewhat Sure |
VS = Very Sure |
| The confidence indicator is intended to convey the visualizer's degree of uncertainty with regard to a particular assumption. |
| Deposit Scenario |
| Metal 1 | Metal 2 | Metal 3 | Metal 4 |
| Gold
Au | Silver
Ag |
|
|
| Grade: | 0.55 g/t | SU | 4.00 g/t | SU | |
| |
|
| Recovery: | 75.0% | SU | 30.0% | SS |
|
|
|
|
| Payable: | 98.0% | SS | 98.0% | SS |
|
|
|
|
| Concentrate Grade: | 0.0% | VS | 0.0% | VS |
|
| Price: | $1,840.45 /oz | VS | $27.74 /oz | VS | |
| |
|
| Price Type: | Spot |
| Spot |
|
|
|
|
|
| Annual Payable: | 71,159 oz |
| 207,007 oz |
|
|
|
|
|
| LOM Payable: | 974,778 oz |
| 2,835,718 oz |
|
|
|
|
|
| Metal 1 Note: The 2019 resource estimate assumed a 72% recovery for gold and 30% for silver. Additional tests completed in 2021 suggest 80% is possible so a boost to 75% has been assumed. Silver is left at 30%. |
| Mining Scenario |
| Tonnage: | 75,000,000 | VU | Strip Rate: | 2.5 | SU |
| Operating Rate (tpd): | 15,000 | SS | Mining Type: | Open Pit | VS |
| Mine Life (years): | 13.7 |
| Startup: | 2022 | SS |
| Tax Treatment: | SLM Straight Line Depreciation | VS | Tax Rate: | 38.0% | VS |
| Tonnage Note: Currently there exists only an inferred 43-101 resource estimate for the Japoneses zone consisting of 11,470,000 at 0.5 g/t Au and 4.3 g/t Ag. This OV assumes that the zones within the 4 parallel trends will total 75 million tonnes with an average grade of 0.55 g/t gold. The specific gravity is 2.5. A PEA planned for mid 2021 aims for a mine life of 5-6 years, so we are expecting an updated resource estimate in the 27-33 million tonne range. |
| Strip Rate Note: Management expects the waste to ore mining rate to be in the 2-3:1 range so 2.5:1 has been adopted. |
| Operating Rate Note: Management has chosen this operating scale in order to achieve 50,000 oz per annum output based on the initial projected grade range of 0.5-0.6 g/t gold. |
| Mining Type Note: This scenario envisions a half dozen open pits centered on the linear mineralized trends at Cerro Caliche. The company has focused drilling on the Buena Suerte and Japoneses which it expects will support a PEA with a 5-6 year mine life at 15,000 tpd. Here we assume that these zones will yield additional tonnage and the flanking Cabeza Blanca-El Colorado and El Rincon-Veta de Oro trends which have yielded higher grades will eventually yield the remaining tonnage. |
| Est Startup Year Note: This is a very aggressive goal by management which assumes a permit and CapEx funding will be in place by Q4 of 2021. |
| Tax Treatment Note: Mexico allows straightline depreciation of CapEx to a maximum of 10 years. This model can only do straightline over the LOM. |
| Tax Rate Note: 30% income tax, 7.5% mining tax, 0.5% "extraordinary mining duty". |
| Cost Scenario |
| Currency | USD Cost | Exchange Rate |
| CapEx: | $25,000,000 | SU | USD | $25,000,000 | 1.000 |
| Sustaining Capital: | $15,000,000 | SU | USD | $15,000,000 | 1.000 |
| Mining Cost ($/t rock): | $1.50 | SS | USD | $1.50 | 1.000 |
| Mining Cost ($/t ore): | $5.25 |
| USD | $5.25 | 1.000 |
| Processing Cost ($/t): | $7.00 | SU | USD | $7.00 | 1.000 |
| Other Cost ($/t): | $0.50 | SS | USD | $0.50 | 1.000 |
| Total OpEx ($/t): | $12.75 |
| USD | $12.75 | 1.000 |
| CapEx Note: Argonaut's San Agustin PEA included 39,000 tpd crushing capacity for a 15,000 tpd operation which contributed to the $40 million CapEx. Sonoro plans only 15,000 tpd crushing capacity, and also does not plan to own and operate its own fleet of trucks. |
| Sustaining Capital Note: Mainly crushing equipment will need to be sustained if Sonoro uses contract mining. |
| Risk Factors - Risk-Adjusted Discount Rate: 8.5% |
| Risk Level | Risk Weight | Confidence | Note |
| Environmental Permitting: | Very Low | 0.5 | SS | All of the property including surface and mineral rights are privately owned. The surrounding area has multiple operating OP and UG mines. |
| Social License: | Very Low | 0.5 | SS | There are no nearby ejidos or villages, the surface rights are owned by a single party who only uses the land for ranching. Assuming the surface rights can be leased or purchased, there should be no social license obstacles. Sonoro has exploration access rights until June 30, 2020 for a CAD $48,000 annual payment. |
| Title: | Low | 1.0 | SU | The project has been assembled through deals with 5 separate vendor groups that require staged payments totaling $4,982,000 over 6 years. There are 2 small blocks within the land package which are owned by a third party with whom Sonoro will likely try to make a deal. Sonoro will need to secure surface rights from the single landowner. |
| Tax: | Low | 1.0 | SS | The tax load is already high, but there is potential for more taxes because the recent 7.5% mining tax which was supposed to go to local governments with jurisdiction over the mine site now simply go into federal coffers. So there is a risk of an outcry from local government taxes which the federal government might deal with by adding more taxes. Plus the current leader AMLO has socialist leanings which in a rising gold market could result in a bigger tax grab. |
| GeoPolitical: | Very Low | 1.0 | SS | The biggest geopolitical issue in Mexico are the drug cartels who create problems for mine development when cannabis or opium is cultivated near the mine site or it sits within a transportation corridor. The Cerro Caliche area in Sonora is not impacted by either of these issues. |
| Infrastructure: | Very Low | 0.5 | SS | A flat area for the heap leach pile exists within the property. Operating mines exist to the north and to the southeast (Premier Gold's Mercedes Mine). Water and power do not appear to be issues. |
| Technical: | Low | 2.5 | SS | The company has all the technical expertise bases covered in house, with the key people in charge of exploration and mine development based in Mexico. The low grade large tonnage scenario assumes that mineralization will be oxidized to an open-pittable. Going from the 35% uncertainty of a PEA to production does increase risk. |
| Management: | Very Low | 0.5 | VS | John Darch has a banking background with extensive past experience during the 1990s and 2000s while involved with the Crew group of companies. The VP Ex Mel Herdrick and VP Op Jorge Diaz are based in Mexico with decades of experience delineating deposits in the case of Herdrick and developing heap leach mines in the case of Diaz who worked with Chester Millar. |
| Financing: | Low | 1.0 | SS | After struggling for a couple years after John Darch joined the company moved quickly in 2020 to raise $8 million and again in April 2021 to raise a further $3 million. The key will be its ability to secure CapEx funding. The company has been working with several potential lenders during the past year. |
| Risk Factor Weight Table |
| Very Low | Low | High | Very High |
|---|
| Environmental Permitting: | 0.5 | 1.0 | 1.5 | 2.0 |
| Social License: | 0.5 | 1.0 | 1.5 | 2.0 |
| Title: | 0.5 | 1.0 | 1.5 | 2.0 |
| Tax: | 0.5 | 1.0 | 1.5 | 2.0 |
| GeoPolitical: | 0.5 | 1.0 | 1.5 | 2.0 |
| Infrastructure: | 0.5 | 1.5 | 2.5 | 4.0 |
| Technical: | 1.0 | 2.5 | 4.0 | 5.5 |
| Management: | 0.5 | 1.5 | 3.0 | 4.0 |
| Financing: | 0.5 | 1.0 | 1.5 | 2.0 |
| The risk adjusted discount rate is the sum of the weight of the risk level assigned to each risk factor. |
| Disclaimer: A visualized outcome is one of many possible outcomes for an exploration project as it moves through the 9 stages of the exploration-development cycle from grassroots to a producing mine with failure as an outcome at any point along the way. The range of possible outcomes for the physical nature of a deposit shrinks after delivery of an initial 43-101 resource estimate. While the nature of the deposit constrains the range of mining scenarios, the cost assumptions will vary as the project moves through the feasibility demonstration stages of the cycle, which affects the economic value of the final outcome. This economic value will also vary according to the prices of the metals targeted for extraction which may change during the years it takes for a project to become a mine. An outcome visualization is thus a compilation of best guess assumptions for the key variables that drive the discounted cash flow model, the basis for assigning an economic value to a mine. An OV is not intended as a prediction, but rather as a framework that allows the incorporation of new information generated by the exploration-development cycle for the project into a valuation model on an ongoing, dynamic basis. |
|
| |
| | You can return to the Top of this page
|
|